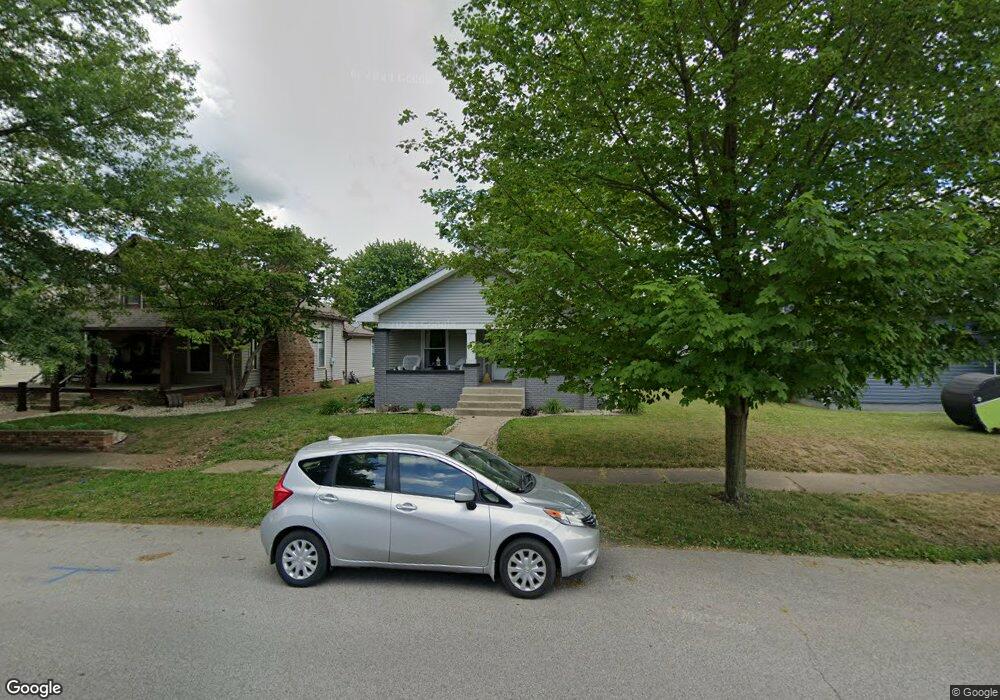
956 S 3rd St Clinton, IN 47842
Estimated Value: $101,000 - $128,231
1
Bed
1
Bath
988
Sq Ft
$113/Sq Ft
Est. Value
About This Home
This home is located at 956 S 3rd St, Clinton, IN 47842 and is currently estimated at $112,058, approximately $113 per square foot. 956 S 3rd St is a home located in Vermillion County with nearby schools including South Vermillion High School and Sacred Heart School.
Ownership History
Date
Name
Owned For
Owner Type
Purchase Details
Closed on
Dec 6, 2021
Sold by
Sandusky Cayli Dawn
Bought by
Merrigan Michele G
Current Estimated Value
Purchase Details
Closed on
Mar 4, 2021
Sold by
Bogetto Cayli D
Bought by
Sandusky Cayli Dawn
Home Financials for this Owner
Home Financials are based on the most recent Mortgage that was taken out on this home.
Original Mortgage
$50,936
Interest Rate
2.7%
Mortgage Type
New Conventional
Purchase Details
Closed on
Dec 17, 2019
Sold by
Sandusky Gregory P and Bogetto Cayli D
Bought by
Bogetto Cayli D
Purchase Details
Closed on
Jul 12, 2019
Sold by
Sandusky Greg and Bogetto Cayli
Bought by
Sandusky Cayli
Purchase Details
Closed on
Apr 17, 2013
Sold by
Busenbark Gary L
Bought by
Bogetto Cayli D and Sandusky Gregory P
Create a Home Valuation Report for This Property
The Home Valuation Report is an in-depth analysis detailing your home's value as well as a comparison with similar homes in the area
Home Values in the Area
Average Home Value in this Area
Purchase History
| Date | Buyer | Sale Price | Title Company |
|---|---|---|---|
| Merrigan Michele G | $111,000 | None Available | |
| Sandusky Cayli Dawn | -- | None Available | |
| Bogetto Cayli D | -- | None Available | |
| Sandusky Cayli | -- | None Available | |
| Bogetto Cayli D | $52,500 | -- | |
| Cayli D | $52,500 | Antonini & Antonini |
Source: Public Records
Mortgage History
| Date | Status | Borrower | Loan Amount |
|---|---|---|---|
| Previous Owner | Sandusky Cayli Dawn | $50,936 |
Source: Public Records
Tax History Compared to Growth
Tax History
| Year | Tax Paid | Tax Assessment Tax Assessment Total Assessment is a certain percentage of the fair market value that is determined by local assessors to be the total taxable value of land and additions on the property. | Land | Improvement |
|---|---|---|---|---|
| 2024 | $613 | $69,200 | $13,100 | $56,100 |
| 2023 | $615 | $65,700 | $13,100 | $52,600 |
| 2022 | $665 | $65,900 | $13,100 | $52,800 |
| 2021 | $496 | $58,500 | $13,100 | $45,400 |
| 2020 | $460 | $53,800 | $16,300 | $37,500 |
| 2019 | $730 | $36,500 | $6,000 | $30,500 |
| 2018 | $289 | $38,100 | $6,000 | $32,100 |
| 2017 | $263 | $37,500 | $6,000 | $31,500 |
| 2016 | $252 | $36,600 | $6,000 | $30,600 |
| 2014 | $229 | $35,700 | $6,000 | $29,700 |
| 2013 | $229 | $35,700 | $6,000 | $29,700 |
Source: Public Records
Map
Nearby Homes
- 947 S Main St
- 0 S Main St
- 1025 S 6th St
- 734 S 6th St
- 525 S 4th St
- 1409 S 4th St
- 1400 S 8th St
- 660 Mulberry St
- 559 Mulberry St
- 1059 Blackman St
- 1146 Blackman St
- 359 N 3rd St
- 522 N Main St
- 2359 E St Rd 163
- 626 N Main St
- 821 N 8th St
- 15034 S Willow Grove Ave
- 945 Morey St
- 1102 Matthews St
- 1108 W Ewing St