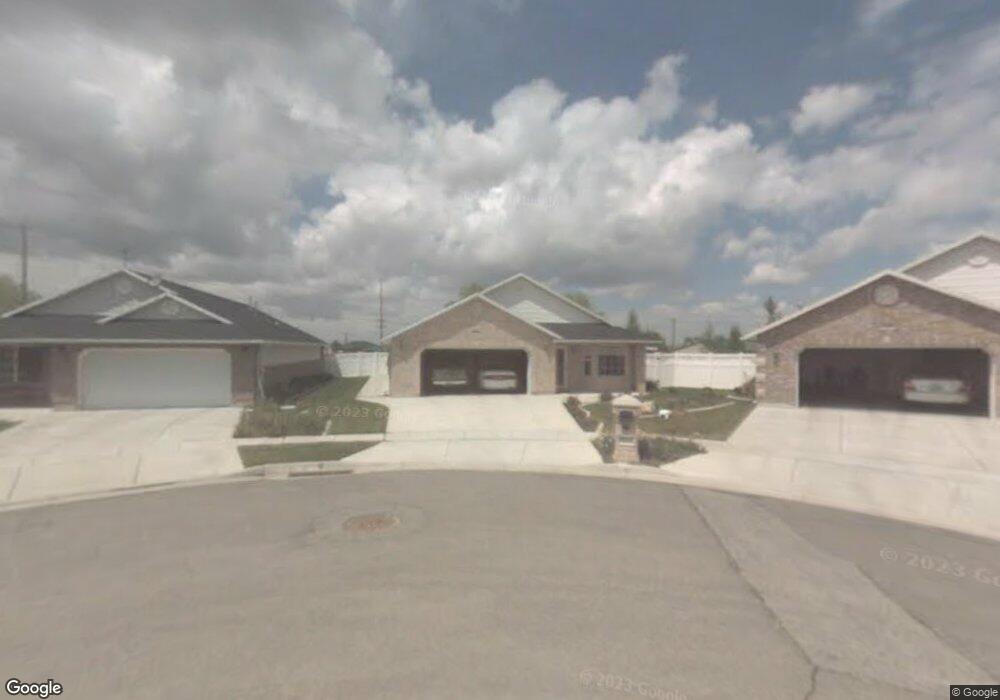
956 W 1730 N Clearfield, UT 84015
Estimated Value: $488,624 - $515,000
3
Beds
2
Baths
1,830
Sq Ft
$278/Sq Ft
Est. Value
About This Home
This home is located at 956 W 1730 N, Clearfield, UT 84015 and is currently estimated at $507,906, approximately $277 per square foot. 956 W 1730 N is a home located in Davis County with nearby schools including Clinton Elementary School, Sunset Junior High School, and Clearfield High School.
Ownership History
Date
Name
Owned For
Owner Type
Purchase Details
Closed on
Nov 6, 2019
Sold by
Calver Christine H and Egbert Denece H
Bought by
Cook Leo J and Cook Marlene C
Current Estimated Value
Purchase Details
Closed on
Oct 10, 2013
Sold by
Hill Marlin J and Hill Jean D
Bought by
Hill Marlin J and Hill Jean D
Purchase Details
Closed on
Jul 15, 2002
Sold by
Windruff Construction
Bought by
Hill Marlin J and Hill Jean D
Purchase Details
Closed on
Jun 17, 1999
Sold by
Castlewood Investments Lc
Bought by
Windruff Construction
Create a Home Valuation Report for This Property
The Home Valuation Report is an in-depth analysis detailing your home's value as well as a comparison with similar homes in the area
Home Values in the Area
Average Home Value in this Area
Purchase History
| Date | Buyer | Sale Price | Title Company |
|---|---|---|---|
| Cook Leo J | -- | Lincoln Title Insu | |
| Hill Marlin J | -- | None Available | |
| Hill Marlin J | -- | Bonneville Title Company Inc | |
| Windruff Construction | -- | Bonneville Title Company Inc |
Source: Public Records
Tax History Compared to Growth
Tax History
| Year | Tax Paid | Tax Assessment Tax Assessment Total Assessment is a certain percentage of the fair market value that is determined by local assessors to be the total taxable value of land and additions on the property. | Land | Improvement |
|---|---|---|---|---|
| 2025 | $2,694 | $259,050 | $88,773 | $170,277 |
| 2024 | $2,618 | $252,999 | $97,742 | $155,257 |
| 2023 | $2,371 | $233,200 | $61,007 | $172,192 |
| 2022 | $2,557 | $460,000 | $124,001 | $335,999 |
| 2021 | $2,514 | $369,000 | $84,789 | $284,211 |
| 2020 | $2,189 | $318,000 | $71,735 | $246,265 |
| 2019 | $2,142 | $304,000 | $84,406 | $219,594 |
| 2018 | $2,008 | $280,000 | $71,368 | $208,632 |
| 2016 | $1,717 | $123,585 | $27,726 | $95,859 |
| 2015 | $1,658 | $113,465 | $27,726 | $85,739 |
| 2014 | $1,630 | $113,358 | $27,726 | $85,632 |
| 2013 | -- | $112,502 | $28,590 | $83,912 |
Source: Public Records
Map
Nearby Homes