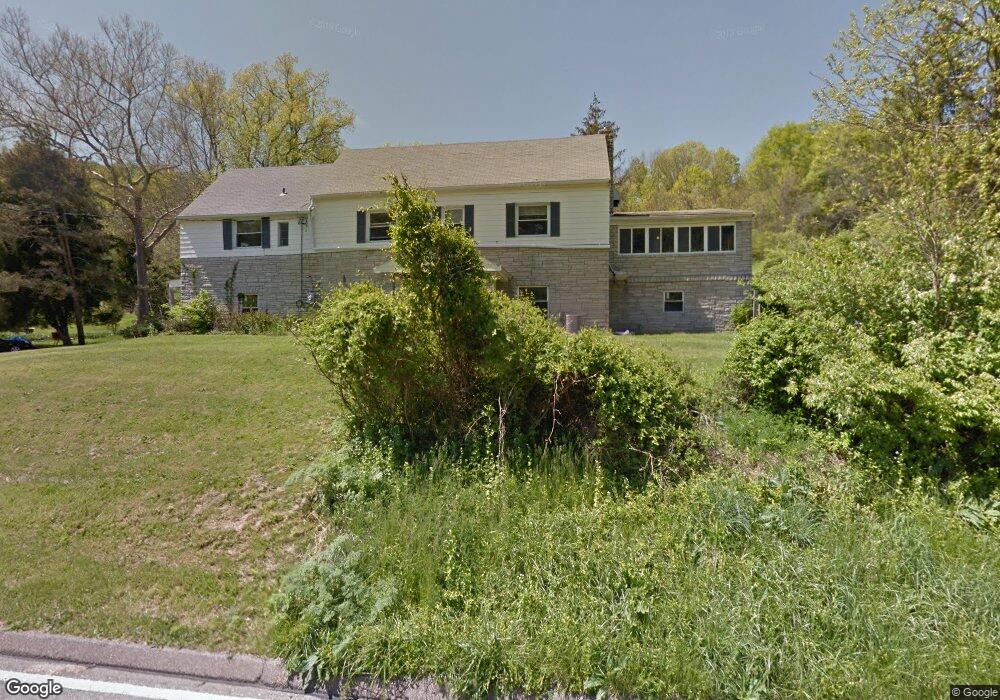
9561 Flick Rd Cincinnati, OH 45247
Estimated Value: $259,000 - $325,000
4
Beds
3
Baths
1,840
Sq Ft
$159/Sq Ft
Est. Value
About This Home
This home is located at 9561 Flick Rd, Cincinnati, OH 45247 and is currently estimated at $292,846, approximately $159 per square foot. 9561 Flick Rd is a home located in Hamilton County with nearby schools including Colerain Elementary School, Colerain Middle School, and Colerain High School.
Ownership History
Date
Name
Owned For
Owner Type
Purchase Details
Closed on
Jun 30, 2022
Sold by
Buhrlage Kerri L
Bought by
Lambrinides Nicholas James and Lambrinides Diane Linda
Current Estimated Value
Home Financials for this Owner
Home Financials are based on the most recent Mortgage that was taken out on this home.
Original Mortgage
$160,000
Outstanding Balance
$150,037
Interest Rate
4.25%
Mortgage Type
New Conventional
Estimated Equity
$142,809
Purchase Details
Closed on
Mar 4, 2022
Sold by
Axel Properties Lic
Bought by
Buhrlage Kerri L
Purchase Details
Closed on
Jul 11, 2013
Sold by
Buhrlage Kerri L
Bought by
Axel Properties Llc
Purchase Details
Closed on
Jan 29, 2003
Sold by
Buhrlage Kerri L
Bought by
Buhrlage Kerri L
Purchase Details
Closed on
Jan 28, 2003
Sold by
Buhrlage Kerri L
Bought by
Buhrlage Kerri L
Purchase Details
Closed on
Sep 10, 1996
Sold by
Buhrlage Kerri L
Bought by
Buhrlage Kerri L
Purchase Details
Closed on
Jun 29, 1995
Sold by
Barkley Ada Pearl
Bought by
Buhrlage Kerri L
Create a Home Valuation Report for This Property
The Home Valuation Report is an in-depth analysis detailing your home's value as well as a comparison with similar homes in the area
Home Values in the Area
Average Home Value in this Area
Purchase History
| Date | Buyer | Sale Price | Title Company |
|---|---|---|---|
| Lambrinides Nicholas James | $200,000 | -- | |
| Lambrinides Nicholas James | $200,000 | None Listed On Document | |
| Buhrlage Kerri L | -- | Humphrey-Schulz Kristen J | |
| Buhrlage Kerri L | -- | Humphrey-Schulz Kristen J | |
| Axel Properties Llc | -- | Attorney | |
| Buhrlage Kerri L | -- | -- | |
| Buhrlage Kerri L | -- | -- | |
| Buhrlage Kerri L | -- | -- | |
| Buhrlage Kerri L | -- | -- |
Source: Public Records
Mortgage History
| Date | Status | Borrower | Loan Amount |
|---|---|---|---|
| Open | Lambrinides Nicholas James | $160,000 | |
| Closed | Lambrinides Nicholas James | $160,000 |
Source: Public Records
Tax History
| Year | Tax Paid | Tax Assessment Tax Assessment Total Assessment is a certain percentage of the fair market value that is determined by local assessors to be the total taxable value of land and additions on the property. | Land | Improvement |
|---|---|---|---|---|
| 2025 | $4,042 | $70,001 | $20,381 | $49,620 |
| 2024 | $3,755 | $70,001 | $20,381 | $49,620 |
| 2023 | $3,773 | $70,001 | $20,381 | $49,620 |
| 2022 | $2,305 | $33,825 | $24,049 | $9,776 |
| 2021 | $2,327 | $33,825 | $24,049 | $9,776 |
| 2020 | $2,300 | $33,825 | $24,049 | $9,776 |
| 2019 | $2,100 | $28,666 | $20,381 | $8,285 |
| 2018 | $1,890 | $28,666 | $20,381 | $8,285 |
| 2017 | $2,545 | $40,268 | $20,381 | $19,887 |
| 2016 | $1,860 | $28,666 | $20,318 | $8,348 |
| 2015 | $2,143 | $33,209 | $20,318 | $12,891 |
| 2014 | $2,412 | $33,209 | $20,318 | $12,891 |
| 2013 | $1,512 | $26,251 | $17,903 | $8,348 |
Source: Public Records
Map
Nearby Homes
- 6823 Thompson Rd
- 7970 Valley Crossing Dr
- 7351 Vista View Cir
- 8515 Merril Ct
- 7117 Fort Scott Blvd
- 6983 Daybreak Dr
- 7102 Fort Scott Blvd
- 9694 Hamilton Cleves Rd
- 10232 Roppelt Rd
- 7880 Austin Ridge Dr
- 9981 Skyridge Dr
- 6594 Springdale Rd
- 5778 Blue Rock Hill Rd
- 5630 Dry Ridge Rd
- 7298 Harrison Ave
- 7284 Harrison Ave
- 102 Fernald Dr Unit 102
- 5761 Babygold Ct
- 7216 Creekview Dr
- 5658 Springdale Rd
- 9541 Flick Rd
- 9505 Flick Rd
- 9479 Flick Rd
- 9480 Flick Rd
- 9790 Flick Rd
- 9558 Flick Rd
- 9460 Flick Rd
- 9095 Lockwood Hill Rd
- 9475 Flick Rd
- 9101 Lockwood Hill Rd
- 9458 Flick Rd
- 9450 Flick Rd
- 9461 Flick Rd
- 9431 Lockwood Hill Rd
- 9401 Lockwood Hill Rd
- 9850 Flick Rd
- 9093 Lockwood Hill Rd
- 9103 Lockwood Hill Rd
- 9103 Lockwood Hill Rd Unit 3
- 7290 Thompson Rd
Your Personal Tour Guide
Ask me questions while you tour the home.