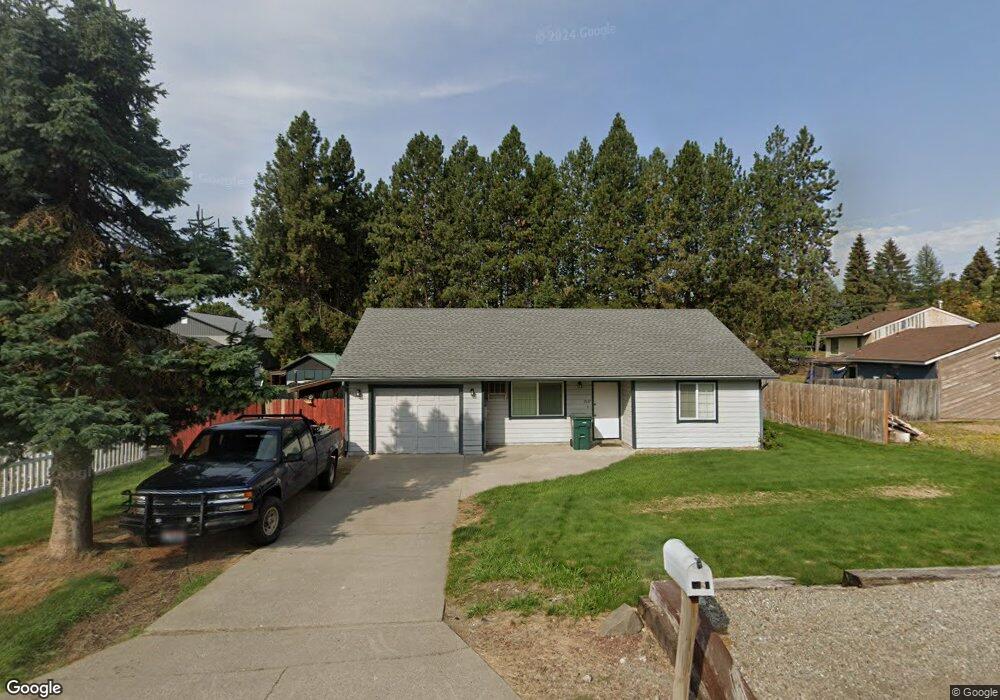
9567 N Ash St Hayden, ID 83835
Estimated Value: $347,000 - $418,000
2
Beds
1
Bath
920
Sq Ft
$420/Sq Ft
Est. Value
About This Home
This home is located at 9567 N Ash St, Hayden, ID 83835 and is currently estimated at $386,704, approximately $420 per square foot. 9567 N Ash St is a home located in Kootenai County with nearby schools including Hayden Meadows Elementary School, Canfield Middle School, and Coeur d'Alene High School.
Ownership History
Date
Name
Owned For
Owner Type
Purchase Details
Closed on
Jun 29, 2015
Sold by
Morris Davina S and Smith Davina S
Bought by
Morris Brian E and Morris Davina S
Current Estimated Value
Purchase Details
Closed on
Dec 14, 2010
Sold by
Morris Davina S and Smith Davina S
Bought by
Morris Brian E and Morris Davina S
Purchase Details
Closed on
Aug 9, 2006
Sold by
Smith Davina S
Bought by
Smith Samuel R and Smith Davina S
Home Financials for this Owner
Home Financials are based on the most recent Mortgage that was taken out on this home.
Original Mortgage
$34,800
Interest Rate
6.76%
Mortgage Type
Balloon
Purchase Details
Closed on
Jun 5, 2006
Sold by
Smith Samuel R
Bought by
Smith Davina S
Home Financials for this Owner
Home Financials are based on the most recent Mortgage that was taken out on this home.
Original Mortgage
$115,500
Interest Rate
6.55%
Mortgage Type
New Conventional
Create a Home Valuation Report for This Property
The Home Valuation Report is an in-depth analysis detailing your home's value as well as a comparison with similar homes in the area
Home Values in the Area
Average Home Value in this Area
Purchase History
| Date | Buyer | Sale Price | Title Company |
|---|---|---|---|
| Morris Brian E | -- | None Available | |
| Morris Brian E | -- | -- | |
| Smith Samuel R | -- | -- | |
| Smith Davina S | -- | -- |
Source: Public Records
Mortgage History
| Date | Status | Borrower | Loan Amount |
|---|---|---|---|
| Previous Owner | Smith Samuel R | $34,800 | |
| Previous Owner | Smith Davina S | $115,500 |
Source: Public Records
Tax History Compared to Growth
Tax History
| Year | Tax Paid | Tax Assessment Tax Assessment Total Assessment is a certain percentage of the fair market value that is determined by local assessors to be the total taxable value of land and additions on the property. | Land | Improvement |
|---|---|---|---|---|
| 2024 | $1,555 | $324,130 | $190,000 | $134,130 |
| 2023 | $1,555 | $332,966 | $200,000 | $132,966 |
| 2022 | $1,656 | $373,072 | $210,000 | $163,072 |
| 2021 | $1,678 | $232,416 | $125,000 | $107,416 |
| 2020 | $1,523 | $184,760 | $100,000 | $84,760 |
| 2019 | $1,526 | $170,254 | $95,000 | $75,254 |
| 2018 | $1,420 | $140,660 | $89,000 | $51,660 |
| 2017 | $1,359 | $125,280 | $74,520 | $50,760 |
| 2016 | $1,265 | $111,310 | $62,100 | $49,210 |
| 2015 | $1,244 | $106,930 | $54,000 | $52,930 |
| 2013 | -- | $86,380 | $36,800 | $49,580 |
Source: Public Records
Map
Nearby Homes
- 9754 N Ptarmigan Dr
- 9830 N Maple St
- 9262 N Secretariat Ln
- 9384 N Baack St
- 10016 N Zack Ct
- 320 E Dakota Ave
- 10102 N Zack Ct
- 107 E Willow Tree Ln
- 9032 N Cuff Rd
- 623 E Maple Place
- 10293 Cedar Ct
- 2484 E Woodstone Dr
- 1268 E Woodstone Ct
- 9603 N Strahorn Rd
- 1305 E Victoria Ave
- 450 E Miles Ave
- 536 E Cloverleaf Dr
- 164 W Hilgren Ave
- 8393 N Cloverleaf Dr
- 1627 Northwood Dr