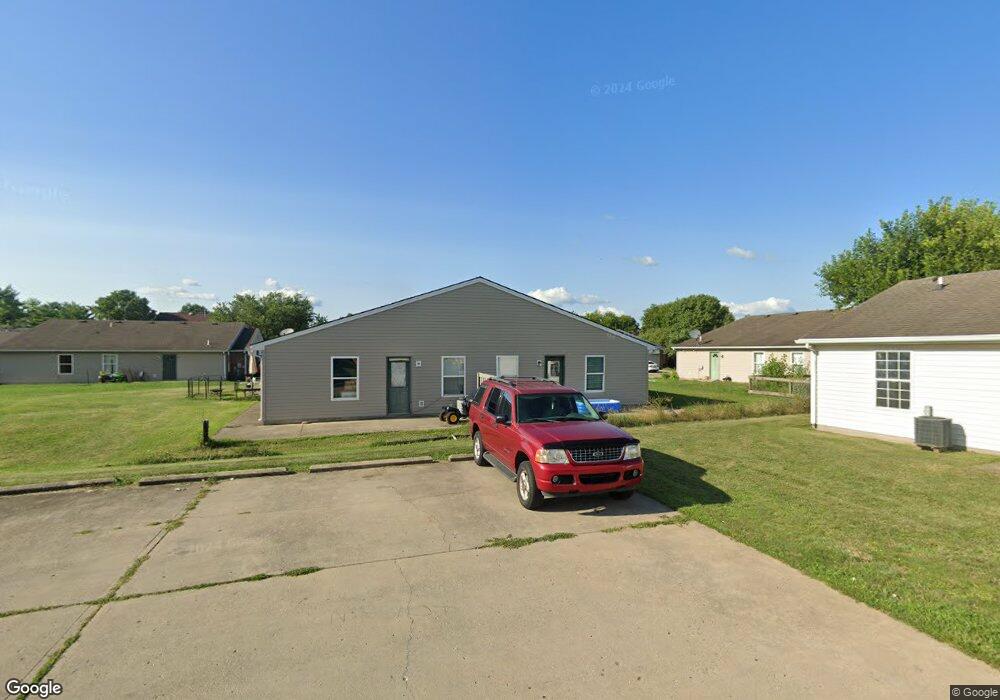
957 Bloomfield Ct Trenton, OH 45067
Estimated Value: $273,000 - $315,558
6
Beds
4
Baths
1,910
Sq Ft
$155/Sq Ft
Est. Value
About This Home
This home is located at 957 Bloomfield Ct, Trenton, OH 45067 and is currently estimated at $295,519, approximately $154 per square foot. 957 Bloomfield Ct is a home located in Butler County with nearby schools including Edgewood Intermediate School and Edgewood High School.
Ownership History
Date
Name
Owned For
Owner Type
Purchase Details
Closed on
Jun 29, 2017
Sold by
Ross Michael
Bought by
Aolb Holdings Llc
Current Estimated Value
Purchase Details
Closed on
May 30, 2006
Sold by
Ross Michael and Ross Kathy
Bought by
Mrkr Llc
Purchase Details
Closed on
Dec 7, 2002
Sold by
Powell Jamie M and Powell Jan C
Bought by
Ross Michael R and Ross Kathy S
Home Financials for this Owner
Home Financials are based on the most recent Mortgage that was taken out on this home.
Original Mortgage
$120,000
Interest Rate
6.25%
Mortgage Type
Construction
Create a Home Valuation Report for This Property
The Home Valuation Report is an in-depth analysis detailing your home's value as well as a comparison with similar homes in the area
Home Values in the Area
Average Home Value in this Area
Purchase History
| Date | Buyer | Sale Price | Title Company |
|---|---|---|---|
| Aolb Holdings Llc | -- | None Available | |
| Mrkr Llc | -- | None Available | |
| Ross Michael R | $22,633 | Advantage Title Company |
Source: Public Records
Mortgage History
| Date | Status | Borrower | Loan Amount |
|---|---|---|---|
| Previous Owner | Ross Michael R | $120,000 |
Source: Public Records
Tax History Compared to Growth
Tax History
| Year | Tax Paid | Tax Assessment Tax Assessment Total Assessment is a certain percentage of the fair market value that is determined by local assessors to be the total taxable value of land and additions on the property. | Land | Improvement |
|---|---|---|---|---|
| 2024 | $3,762 | $84,130 | $10,870 | $73,260 |
| 2023 | $3,616 | $84,130 | $10,870 | $73,260 |
| 2022 | $2,961 | $60,500 | $10,870 | $49,630 |
| 2021 | $2,847 | $60,500 | $10,870 | $49,630 |
| 2020 | $3,034 | $60,500 | $10,870 | $49,630 |
| 2019 | $2,526 | $44,030 | $10,840 | $33,190 |
| 2018 | $2,344 | $44,030 | $10,840 | $33,190 |
| 2017 | $2,345 | $44,030 | $10,840 | $33,190 |
| 2016 | $2,148 | $38,500 | $10,840 | $27,660 |
| 2015 | $1,832 | $38,500 | $10,840 | $27,660 |
| 2014 | $1,964 | $38,500 | $10,840 | $27,660 |
| 2013 | $1,964 | $38,500 | $10,840 | $27,660 |
Source: Public Records
Map
Nearby Homes
- 983 Pom Ct
- 984 Pom Ct
- 984 Pom Ct Unit A
- 931 E Branch Ct
- 5373 Gabbard Dr
- 917 Hathaway Dr
- 807 Somerset Ct
- 700 Villa Ct
- 801 Carriage Ln
- 717 Villa Ct
- 807 Countryside Ave
- 914 Providence Ct
- 220 Governors Ave
- 821 Prescot Cir
- 109 Cranewood Dr
- 408 Pierson Rd
- 801 Prescot Cir
- 202 W State St
- 301 Maple Ave
- 425 Heritage Place