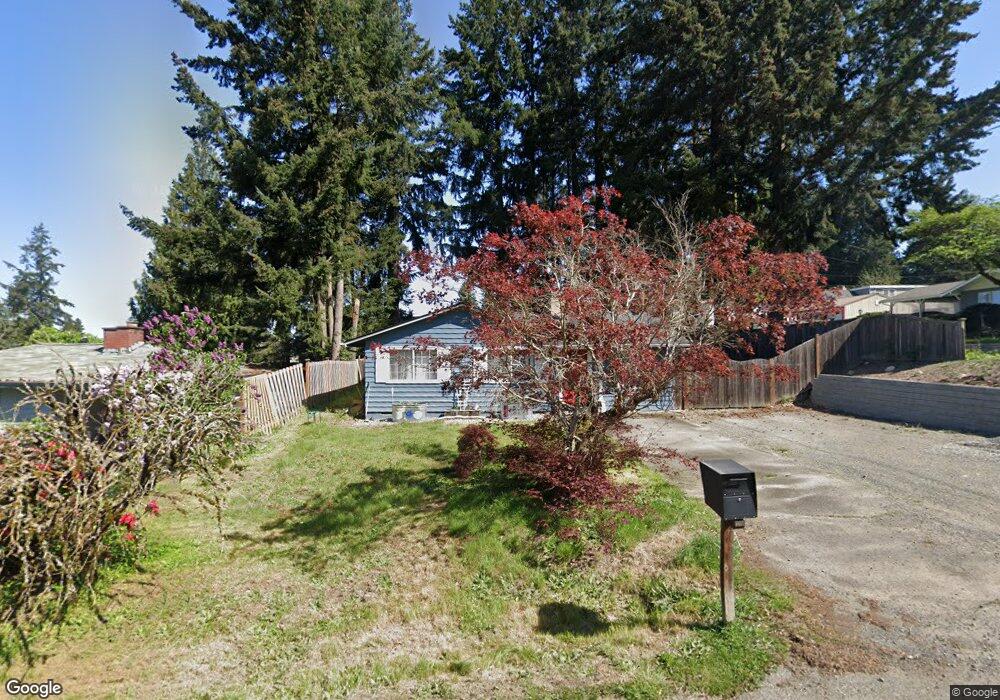
957 E Maple St Kent, WA 98030
Scenic Hill NeighborhoodEstimated Value: $508,360 - $550,000
3
Beds
1
Bath
1,270
Sq Ft
$420/Sq Ft
Est. Value
About This Home
This home is located at 957 E Maple St, Kent, WA 98030 and is currently estimated at $533,090, approximately $419 per square foot. 957 E Maple St is a home located in King County with nearby schools including Scenic Hill Elementary School and Kent-Meridian High School.
Ownership History
Date
Name
Owned For
Owner Type
Purchase Details
Closed on
Sep 23, 2006
Sold by
Jacobs Bruce L and Jacobs Christy
Bought by
Gray Sean Alex and Gray Susan Michelle
Current Estimated Value
Home Financials for this Owner
Home Financials are based on the most recent Mortgage that was taken out on this home.
Original Mortgage
$258,360
Outstanding Balance
$207,917
Interest Rate
6.53%
Mortgage Type
Purchase Money Mortgage
Estimated Equity
$325,173
Purchase Details
Closed on
Sep 23, 2002
Sold by
Langworthy Bruce W
Bought by
Jacobs Bruce L and Jacobs Christy
Home Financials for this Owner
Home Financials are based on the most recent Mortgage that was taken out on this home.
Original Mortgage
$162,500
Interest Rate
6.16%
Purchase Details
Closed on
Apr 23, 1998
Sold by
White Cheryl M
Bought by
Langworthy Bruce W
Home Financials for this Owner
Home Financials are based on the most recent Mortgage that was taken out on this home.
Original Mortgage
$123,750
Interest Rate
7.06%
Create a Home Valuation Report for This Property
The Home Valuation Report is an in-depth analysis detailing your home's value as well as a comparison with similar homes in the area
Home Values in the Area
Average Home Value in this Area
Purchase History
| Date | Buyer | Sale Price | Title Company |
|---|---|---|---|
| Gray Sean Alex | $258,360 | Ticor National | |
| Jacobs Bruce L | $162,500 | Washington Title Company | |
| Langworthy Bruce W | $137,500 | Old Republic Title Ltd |
Source: Public Records
Mortgage History
| Date | Status | Borrower | Loan Amount |
|---|---|---|---|
| Open | Gray Sean Alex | $258,360 | |
| Previous Owner | Jacobs Bruce L | $162,500 | |
| Previous Owner | Langworthy Bruce W | $123,750 |
Source: Public Records
Tax History
| Year | Tax Paid | Tax Assessment Tax Assessment Total Assessment is a certain percentage of the fair market value that is determined by local assessors to be the total taxable value of land and additions on the property. | Land | Improvement |
|---|---|---|---|---|
| 2024 | $4,800 | $477,000 | $215,000 | $262,000 |
| 2023 | $4,796 | $425,000 | $215,000 | $210,000 |
| 2022 | $4,373 | $461,000 | $221,000 | $240,000 |
| 2021 | $3,937 | $368,000 | $179,000 | $189,000 |
| 2020 | $3,758 | $315,000 | $153,000 | $162,000 |
| 2018 | $3,415 | $291,000 | $122,000 | $169,000 |
| 2017 | $3,009 | $258,000 | $117,000 | $141,000 |
| 2016 | $3,045 | $231,000 | $128,000 | $103,000 |
| 2015 | $2,813 | $222,000 | $122,000 | $100,000 |
| 2014 | -- | $200,000 | $122,000 | $78,000 |
| 2013 | -- | $179,000 | $122,000 | $57,000 |
Source: Public Records
Map
Nearby Homes
- 718 E Walnut St
- 1324 E Walnut St
- 812 Maplewood Ave
- 8521 S 259th St Unit B-15
- 700 Reiten Rd
- 1510 Maple Ln Unit 7
- 1540 Maple Ln Unit 29
- 1529 Maple Ln Unit L2-4
- 1720 Maple Ln Unit 11
- 1720 Maple Ln Unit 33
- 722 E Tacoma St
- 24842 96th Ave S
- 9808 S 252nd St
- 25120 98th Place S Unit A105
- 9623 S 248th St Unit 5
- 9623 S 248th St Unit 8
- 9623 S 248th St Unit 11
- 25035 98th Place S Unit D-102
- 25131 98th Place S Unit B110
- 26301 Woodland Way S
- 951 E Maple St
- 945 E Maple St
- 958 E Walnut St
- 920 Garfield Ave
- 1005 E Maple St
- 950 E Walnut St
- 939 E Maple St
- 1007 Garfield Ave
- 1004 E Walnut St
- 944 E Maple St
- 942 E Walnut St
- 1010 E Walnut St
- 1015 E Maple St
- 933 E Maple St
- 938 E Maple St
- 934 E Walnut St
- 8 XX E Maple St
- 1018 E Walnut St
- 925 E Maple St
Your Personal Tour Guide
Ask me questions while you tour the home.