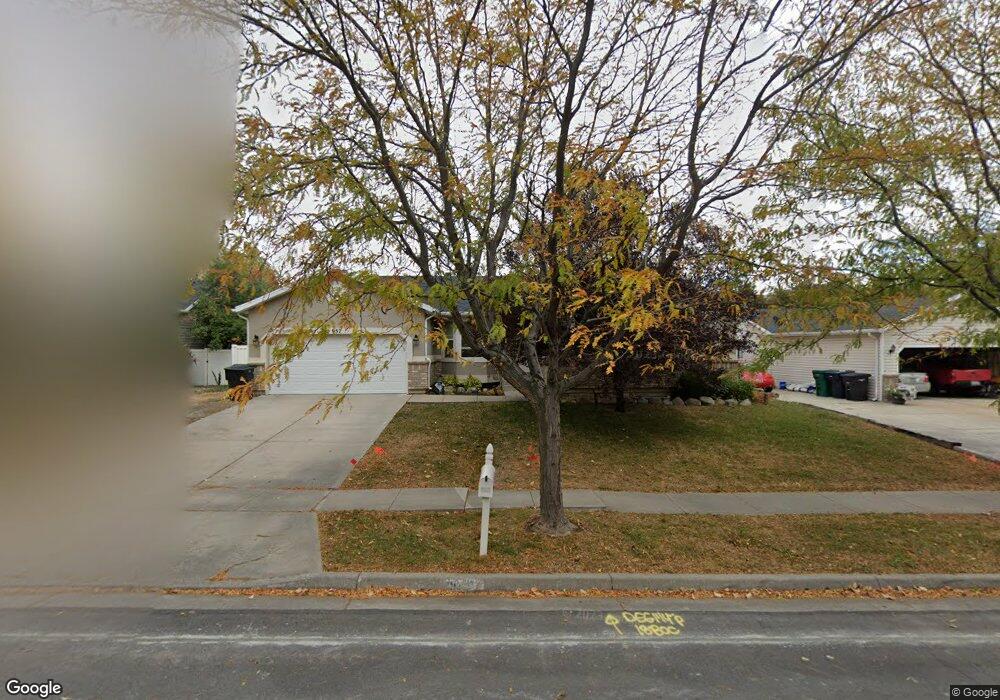
957 S 1025 W Woods Cross, UT 84087
Estimated Value: $548,000 - $598,000
--
Bed
3
Baths
1,745
Sq Ft
$334/Sq Ft
Est. Value
About This Home
This home is located at 957 S 1025 W, Woods Cross, UT 84087 and is currently estimated at $583,623, approximately $334 per square foot. 957 S 1025 W is a home located in Davis County with nearby schools including Woods Cross Elementary School, Millcreek Junior High School, and Woods Cross High School.
Ownership History
Date
Name
Owned For
Owner Type
Purchase Details
Closed on
Jun 15, 2010
Sold by
Ostler Michelle N
Bought by
Ostler Michelle N
Current Estimated Value
Purchase Details
Closed on
Mar 2, 2010
Sold by
Ostler Michelle N
Bought by
Ostler Michelle N
Purchase Details
Closed on
Aug 3, 2007
Sold by
Ostler Michelle Nielsen
Bought by
Ostler John T and Ostler Michelle N
Purchase Details
Closed on
Jul 20, 2007
Sold by
Keith C Nielsen Family Lp
Bought by
Ostler Michelle Nielsen
Purchase Details
Closed on
Mar 10, 2004
Sold by
Kbcc Nielsen Properties Lc
Bought by
Keith C Nielsen Family Lp
Purchase Details
Closed on
Oct 16, 2000
Sold by
Dakota Homes Inc
Bought by
Keith C Nielsen Family Ltd Partnership
Purchase Details
Closed on
Sep 19, 2000
Sold by
Dakota Homes Inc
Bought by
Keith C Nielsen Family Ltd Partnership
Create a Home Valuation Report for This Property
The Home Valuation Report is an in-depth analysis detailing your home's value as well as a comparison with similar homes in the area
Home Values in the Area
Average Home Value in this Area
Purchase History
| Date | Buyer | Sale Price | Title Company |
|---|---|---|---|
| Ostler Michelle N | -- | None Available | |
| Ostler Michelle N | -- | None Available | |
| Ostler John T | -- | None Available | |
| Ostler Michelle Nielsen | -- | None Available | |
| Keith C Nielsen Family Lp | -- | -- | |
| Keith C Nielsen Family Ltd Partnership | -- | Meridian Title Company | |
| Keith C Nielsen Family Ltd Partnership | -- | Meridian Title Company |
Source: Public Records
Tax History Compared to Growth
Tax History
| Year | Tax Paid | Tax Assessment Tax Assessment Total Assessment is a certain percentage of the fair market value that is determined by local assessors to be the total taxable value of land and additions on the property. | Land | Improvement |
|---|---|---|---|---|
| 2025 | $3,684 | $320,100 | $109,958 | $210,142 |
| 2024 | $3,479 | $308,000 | $116,886 | $191,114 |
| 2023 | $3,299 | $297,550 | $84,999 | $212,550 |
| 2022 | $3,450 | $573,000 | $122,155 | $450,845 |
| 2021 | $2,985 | $432,000 | $98,451 | $333,549 |
| 2020 | $2,673 | $382,000 | $93,665 | $288,335 |
| 2019 | $2,641 | $371,000 | $87,563 | $283,437 |
| 2018 | $2,471 | $344,000 | $86,141 | $257,859 |
| 2016 | $2,004 | $151,305 | $36,326 | $114,979 |
| 2015 | $1,898 | $137,445 | $36,326 | $101,119 |
| 2014 | $1,844 | $136,549 | $36,326 | $100,223 |
| 2013 | -- | $124,960 | $26,877 | $98,083 |
Source: Public Records
Map
Nearby Homes
- 1137 S 1050 W
- 1056 W Audrey Ln Unit 14
- 1069 W Linden Ln Unit 31
- 1064 W Audrey Ln Unit 15
- 1072 W Audrey Ln Unit 17
- 1067 W Audrey Ln Unit 8
- 1075 W Audrey Ln Unit 6
- Swiss 2 - Urban Plan at The Audrey - theAUDREY
- Swiss 3 - Urban Plan at The Audrey - theAUDREY
- Swiss 1 - Cottage Plan at The Audrey - theAUDREY
- Swiss 4 - Cottage Plan at The Audrey - theAUDREY
- Swiss 2 - Cottage Plan at The Audrey - theAUDREY
- Swiss 3 - Cottage Plan at The Audrey - theAUDREY
- Swiss 4 - Urban Plan at The Audrey - theAUDREY
- Swiss 1 - Urban Plan at The Audrey - theAUDREY
- 1321 S 840 W
- 1552 S 850 W
- 743 W 1000 S
- 1623 S 925 W
- 734 W 1300 S Unit W