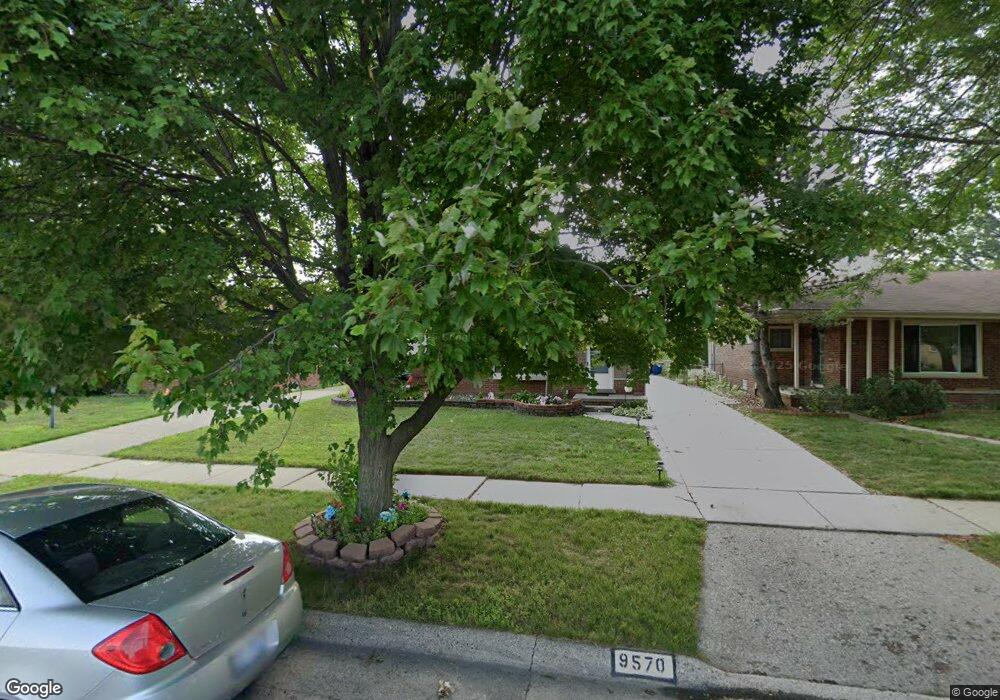
9570 Salem Redford, MI 48239
Estimated Value: $186,000 - $221,000
3
Beds
2
Baths
1,080
Sq Ft
$187/Sq Ft
Est. Value
About This Home
This home is located at 9570 Salem, Redford, MI 48239 and is currently estimated at $202,188, approximately $187 per square foot. 9570 Salem is a home located in Wayne County with nearby schools including John D. Pierce Middle School, Lee M. Thurston High School, and Global Heights Academy.
Ownership History
Date
Name
Owned For
Owner Type
Purchase Details
Closed on
Sep 10, 2014
Sold by
Te Consulting Llc
Bought by
Fitzpatrick Thomas E
Current Estimated Value
Purchase Details
Closed on
Dec 14, 2012
Sold by
Eakin Jason and Eakin Jessica
Bought by
Te Consulting Llc
Purchase Details
Closed on
Nov 4, 2009
Sold by
Fox Paul A
Bought by
Federal National Mortgage Association
Purchase Details
Closed on
Feb 28, 2003
Sold by
Corbin Nancy Ann and Dickie Roberta Lou
Bought by
Fox Paul A
Create a Home Valuation Report for This Property
The Home Valuation Report is an in-depth analysis detailing your home's value as well as a comparison with similar homes in the area
Home Values in the Area
Average Home Value in this Area
Purchase History
| Date | Buyer | Sale Price | Title Company |
|---|---|---|---|
| Fitzpatrick Thomas E | $71,800 | Stg | |
| Te Consulting Llc | -- | Liberty Title | |
| Federal National Mortgage Association | $138,322 | None Available | |
| Fox Paul A | $133,000 | Commonwealth Land Title |
Source: Public Records
Tax History Compared to Growth
Tax History
| Year | Tax Paid | Tax Assessment Tax Assessment Total Assessment is a certain percentage of the fair market value that is determined by local assessors to be the total taxable value of land and additions on the property. | Land | Improvement |
|---|---|---|---|---|
| 2025 | $945 | $88,800 | $0 | $0 |
| 2024 | $945 | $82,800 | $0 | $0 |
| 2023 | $905 | $71,700 | $0 | $0 |
| 2022 | $2,616 | $61,400 | $0 | $0 |
| 2021 | $2,542 | $57,800 | $0 | $0 |
| 2020 | $2,507 | $52,800 | $0 | $0 |
| 2019 | $2,452 | $45,800 | $0 | $0 |
| 2018 | $814 | $38,700 | $0 | $0 |
| 2017 | $2,817 | $35,900 | $0 | $0 |
| 2016 | $2,196 | $37,100 | $0 | $0 |
| 2015 | $3,420 | $34,200 | $0 | $0 |
| 2013 | $2,800 | $28,600 | $0 | $0 |
| 2012 | $2,436 | $31,700 | $7,800 | $23,900 |
Source: Public Records
Map
Nearby Homes