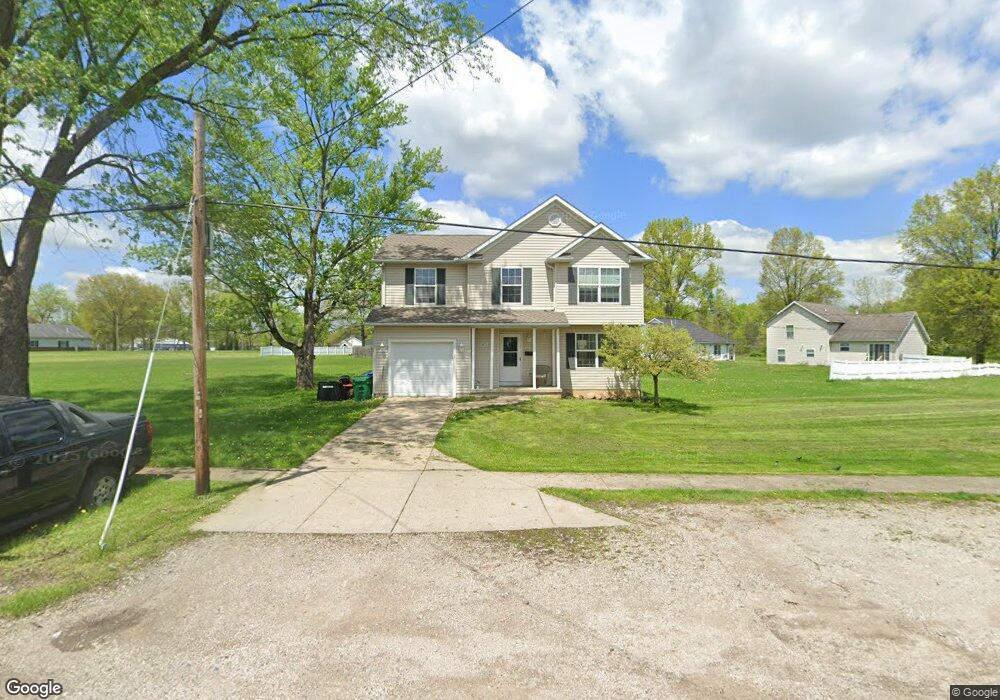
9571 Cloverleaf Rd Windham, OH 44288
Estimated Value: $160,000 - $184,000
4
Beds
3
Baths
1,512
Sq Ft
$114/Sq Ft
Est. Value
About This Home
This home is located at 9571 Cloverleaf Rd, Windham, OH 44288 and is currently estimated at $171,869, approximately $113 per square foot. 9571 Cloverleaf Rd is a home located in Portage County with nearby schools including Katherine Thomas Elementary School, Windham Junior High School, and Windham High School.
Ownership History
Date
Name
Owned For
Owner Type
Purchase Details
Closed on
Aug 1, 2022
Sold by
Portage Homes Iii Lp
Bought by
Rutherford Amy E
Current Estimated Value
Home Financials for this Owner
Home Financials are based on the most recent Mortgage that was taken out on this home.
Original Mortgage
$57,800
Outstanding Balance
$54,941
Interest Rate
5.78%
Mortgage Type
New Conventional
Estimated Equity
$116,928
Purchase Details
Closed on
Nov 14, 2003
Sold by
Testa Enterprises Inc
Bought by
Portage Homes Iii Lp
Purchase Details
Closed on
Feb 24, 2003
Sold by
Maple Grove Iii Lp
Bought by
Community & Economic Development Corp
Purchase Details
Closed on
Dec 22, 1992
Bought by
Maple Grove Iii A Limited
Create a Home Valuation Report for This Property
The Home Valuation Report is an in-depth analysis detailing your home's value as well as a comparison with similar homes in the area
Purchase History
| Date | Buyer | Sale Price | Title Company |
|---|---|---|---|
| Rutherford Amy E | -- | None Listed On Document | |
| Portage Homes Iii Lp | $150,000 | Asta | |
| Testa Enterprises Inc | -- | Asta | |
| Community & Economic Development Corp | -- | Approved Statewide Title Age | |
| Maple Grove Iii A Limited | $174,000 | -- |
Source: Public Records
Mortgage History
| Date | Status | Borrower | Loan Amount |
|---|---|---|---|
| Open | Rutherford Amy E | $57,800 |
Source: Public Records
Tax History
| Year | Tax Paid | Tax Assessment Tax Assessment Total Assessment is a certain percentage of the fair market value that is determined by local assessors to be the total taxable value of land and additions on the property. | Land | Improvement |
|---|---|---|---|---|
| 2025 | $1,819 | $42,390 | $2,630 | $39,760 |
| 2024 | $1,780 | $42,390 | $2,630 | $39,760 |
| 2023 | $683 | $14,180 | $2,700 | $11,480 |
| 2022 | $657 | $14,180 | $2,700 | $11,480 |
| 2021 | $649 | $14,180 | $2,700 | $11,480 |
| 2020 | $513 | $10,510 | $2,070 | $8,440 |
| 2019 | $526 | $10,510 | $2,070 | $8,440 |
| 2018 | $502 | $10,090 | $2,070 | $8,020 |
| 2017 | $502 | $10,090 | $2,070 | $8,020 |
| 2016 | $498 | $10,090 | $2,070 | $8,020 |
| 2015 | $498 | $10,090 | $2,070 | $8,020 |
| 2014 | $520 | $10,510 | $2,070 | $8,440 |
| 2013 | $514 | $10,510 | $2,070 | $8,440 |
Source: Public Records
Map
Nearby Homes
- 8935 S Main St
- 9008 Wilverne Dr
- 9852 Belden Dr
- 9155 Linden Cir
- 9870 Short Dr
- 9278 Bryant Rd
- V/L Parkman Rd
- 0 Bryant & Sr 82
- 0 Bryant Rd
- 9700 Silica Sand Rd
- 0 Stanley Rd
- 9737 Stanley Rd
- 859 N Jewell Rd
- 10168 Stanley Rd
- 7795 Ohio 303
- 5177 Nelson Mosier Rd
- 10154 Ohio 88
- 809 State Route 534 NW
- 8405 Eagle Creek Dr
- 10650 Liberty St
- 9117 Maple Grove Rd
- 9576 Cloverleaf Rd
- 9123 Maple Grove Rd
- 9590 Cloverleaf Rd
- 9555 Cloverleaf Rd
- 9568 Cloverleaf Rd
- 9129 Maple Grove Rd
- 9133 Maple Grove Rd
- 9560 Cloverleaf Rd
- 9547 Cloverleaf Rd
- 9552 Cloverleaf Rd
- 9544 Cloverleaf Rd
- 9581 Greenmeadow Rd
- 9143 Maple Grove Rd
- 9565 Greenmeadow Rd
- 9603 Greenmeadow Rd
- 9593 Greenmeadow Rd
- 9538 Cloverleaf Rd
- 9136 Maple Grove Rd
- 9145 Maple Grove Rd
Your Personal Tour Guide
Ask me questions while you tour the home.