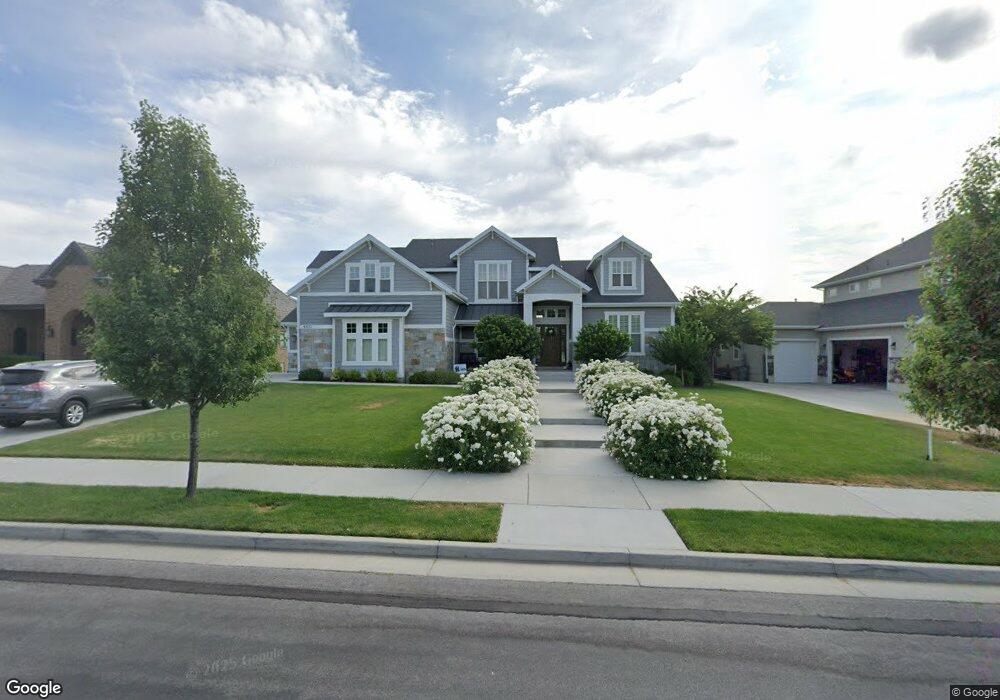
9571 S Willow Trail Way Unit 12 South Jordan, UT 84095
Estimated Value: $1,580,000 - $2,344,869
5
Beds
3
Baths
4,077
Sq Ft
$474/Sq Ft
Est. Value
About This Home
This home is located at 9571 S Willow Trail Way Unit 12, South Jordan, UT 84095 and is currently estimated at $1,931,956, approximately $473 per square foot. 9571 S Willow Trail Way Unit 12 is a home located in Salt Lake County with nearby schools including South Jordan School, South Jordan Middle School, and Hawthorn Academy.
Ownership History
Date
Name
Owned For
Owner Type
Purchase Details
Closed on
Jan 13, 2021
Sold by
Owens Casey Ray and Owens Kathryn Irion
Bought by
Owens Casey and Owens Kathryn
Current Estimated Value
Home Financials for this Owner
Home Financials are based on the most recent Mortgage that was taken out on this home.
Original Mortgage
$1,021,600
Outstanding Balance
$911,781
Interest Rate
2.71%
Mortgage Type
New Conventional
Estimated Equity
$1,020,175
Purchase Details
Closed on
Apr 7, 2016
Sold by
Wilson Robyn Lynn and Wilson Sean T
Bought by
Owens Casey Ray and Owens Kathryn Irion
Purchase Details
Closed on
Jan 27, 2015
Sold by
Chavez Tony A and Chavez Dennis M
Bought by
Wilson Robyn Lynn and Wilson Sean T
Create a Home Valuation Report for This Property
The Home Valuation Report is an in-depth analysis detailing your home's value as well as a comparison with similar homes in the area
Home Values in the Area
Average Home Value in this Area
Purchase History
| Date | Buyer | Sale Price | Title Company |
|---|---|---|---|
| Owens Casey | -- | Oasis Title Llc | |
| Owens Casey Ray | -- | North American Title Llc | |
| Wilson Robyn Lynn | -- | Magellan Title |
Source: Public Records
Mortgage History
| Date | Status | Borrower | Loan Amount |
|---|---|---|---|
| Open | Owens Casey | $1,021,600 |
Source: Public Records
Tax History Compared to Growth
Tax History
| Year | Tax Paid | Tax Assessment Tax Assessment Total Assessment is a certain percentage of the fair market value that is determined by local assessors to be the total taxable value of land and additions on the property. | Land | Improvement |
|---|---|---|---|---|
| 2025 | $9,068 | $1,962,200 | $531,900 | $1,430,300 |
| 2024 | $9,068 | $1,721,700 | $517,900 | $1,203,800 |
| 2023 | $9,233 | $1,654,000 | $412,500 | $1,241,500 |
| 2022 | $10,166 | $1,785,000 | $404,400 | $1,380,600 |
| 2021 | $8,669 | $1,396,600 | $324,700 | $1,071,900 |
| 2020 | $7,386 | $1,115,300 | $309,200 | $806,100 |
| 2019 | $7,029 | $1,043,400 | $291,800 | $751,600 |
| 2018 | $6,732 | $994,300 | $291,800 | $702,500 |
| 2017 | $6,504 | $941,500 | $393,300 | $548,200 |
| 2016 | $3,147 | $237,400 | $237,400 | $0 |
| 2015 | $3,981 | $292,000 | $292,000 | $0 |
| 2014 | $2,958 | $213,200 | $213,200 | $0 |
Source: Public Records
Map
Nearby Homes
- 9532 S Willow Trail Way
- 1116 W 9440 S
- 9837 Jordan Ridge Rd
- 9297 S Avignon Place
- 9847 S 1000 W
- 885 W Chartres Ave
- 9332 S Chartres Ave
- 8686 S Temple Dr
- 9909 Dream Cir
- 1113 W River Pass Cove
- 9121 S Hidden Peak Dr
- 9847 S Castello Ct Unit 5
- 9095 S 1150 W
- 1184 W Michaelsen Way
- 9141 S Little Creek Dr
- 662 W Jefferson Cove
- 8976 S 1050 W
- 9635 S 1600 W
- 9909 Reunion Glen Way
- 9909 W Reunion Ave
- 9569 S Willow Trail Way Unit 11
- 9589 S Willow Trail Way Unit 13
- 9607 S Willow Trail Way
- 9607 S Willow Trail Way Unit 14
- 9582 S Willow Trail Way Unit 4
- 9547 S Willow Trail Way Unit 10
- 9607 S Willow Trail Way
- 9602 S Willow Trail Way Unit 3
- 9568 S Willow Trail Way Unit 5
- 9602 S Willow Trail Way Unit 3
- 9602 S Willow Trail Way
- 9568 S Willow Trail Way Unit 5
- 9556 S Willow Trail Way
- 9628 S Willow Trail Way
- 9628 S Willow Trail Way Unit 2
- 9631 S Willow Trail Way Unit 15
- 9631 S Willow Trail Way
- 9529 S Willow Trail Way
- 9529 S Willow Trail Way Unit 9
- 9544 S Willow Trail Way Unit 7