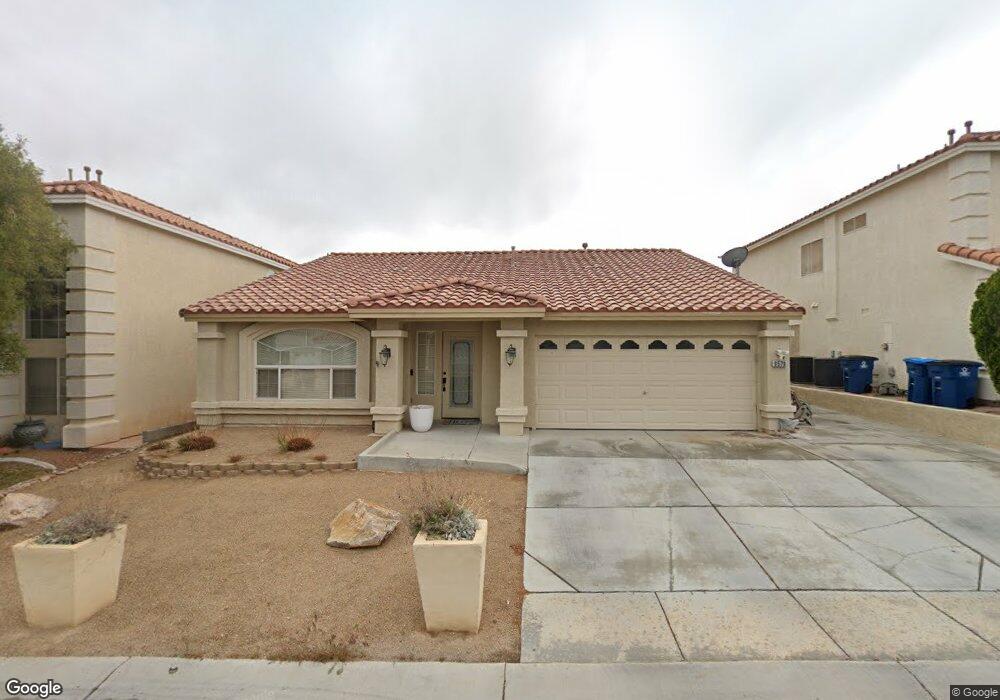
9579 Adobe Arch Ct Las Vegas, NV 89148
Estimated Value: $458,482 - $492,000
3
Beds
2
Baths
1,704
Sq Ft
$280/Sq Ft
Est. Value
About This Home
This home is located at 9579 Adobe Arch Ct, Las Vegas, NV 89148 and is currently estimated at $477,121, approximately $280 per square foot. 9579 Adobe Arch Ct is a home located in Clark County with nearby schools including Sandra B Abston Elementary School, Victoria Fertitta Middle School, and Durango High School.
Ownership History
Date
Name
Owned For
Owner Type
Purchase Details
Closed on
Jul 8, 2014
Sold by
Fernandez Mario Andres
Bought by
Fernandez Mario Andres and Fernandez 2014 Irrevocable Trust
Current Estimated Value
Purchase Details
Closed on
Jan 17, 2014
Sold by
Fernandez Jose M
Bought by
Fernandez Mario Andres
Purchase Details
Closed on
Sep 17, 2003
Sold by
Fernandez Nidia
Bought by
Fernandez Jose M and Fernandez Mario Andres
Purchase Details
Closed on
Feb 12, 2002
Sold by
Fernandez Lori Lynn
Bought by
Fernandez Jose M
Home Financials for this Owner
Home Financials are based on the most recent Mortgage that was taken out on this home.
Original Mortgage
$151,750
Interest Rate
7.13%
Purchase Details
Closed on
Jan 30, 2002
Sold by
American West Homes Inc
Bought by
Fernandez A Nadia and Fernandez Jose M
Home Financials for this Owner
Home Financials are based on the most recent Mortgage that was taken out on this home.
Original Mortgage
$151,750
Interest Rate
7.13%
Create a Home Valuation Report for This Property
The Home Valuation Report is an in-depth analysis detailing your home's value as well as a comparison with similar homes in the area
Home Values in the Area
Average Home Value in this Area
Purchase History
| Date | Buyer | Sale Price | Title Company |
|---|---|---|---|
| Fernandez Mario Andres | -- | None Available | |
| Fernandez Mario Andres | -- | None Available | |
| Fernandez Jose M | -- | -- | |
| Fernandez Nidia | -- | -- | |
| Fernandez Jose M | $168,650 | First American Title Co | |
| Fernandez A Nadia | $168,650 | First American Title Co |
Source: Public Records
Mortgage History
| Date | Status | Borrower | Loan Amount |
|---|---|---|---|
| Previous Owner | Fernandez A Nadia | $151,750 |
Source: Public Records
Tax History Compared to Growth
Tax History
| Year | Tax Paid | Tax Assessment Tax Assessment Total Assessment is a certain percentage of the fair market value that is determined by local assessors to be the total taxable value of land and additions on the property. | Land | Improvement |
|---|---|---|---|---|
| 2025 | $1,927 | $113,029 | $42,700 | $70,329 |
| 2024 | $1,872 | $113,029 | $42,700 | $70,329 |
| 2023 | $1,432 | $104,038 | $37,450 | $66,588 |
| 2022 | $1,992 | $92,562 | $31,850 | $60,712 |
| 2021 | $1,845 | $86,004 | $28,350 | $57,654 |
| 2020 | $1,710 | $82,758 | $25,550 | $57,208 |
| 2019 | $1,603 | $79,682 | $23,450 | $56,232 |
| 2018 | $1,529 | $75,119 | $21,000 | $54,119 |
| 2017 | $2,150 | $73,325 | $18,550 | $54,775 |
| 2016 | $1,432 | $67,068 | $14,000 | $53,068 |
| 2015 | $1,429 | $64,476 | $10,500 | $53,976 |
| 2014 | $1,385 | $45,796 | $8,400 | $37,396 |
Source: Public Records
Map
Nearby Homes
- 9580 W Reno Ave Unit 261
- 9580 W Reno Ave Unit 240
- 9580 W Reno Ave Unit 233
- 9580 W Reno Ave Unit 238
- 9693 Bighorn Island Ave
- 9522 Arrowhead Falls Ct
- 5048 Orchid Springs St
- 9731 Cathedral Stairs Ct
- 5076 Thunder River Cir
- 9631 Tuscola Ct
- 5077 Thunder River Cir
- 5014 Thunder River Cir
- 5015 Thunder River Cir
- 9821 Sedona Shrine Ave
- 9687 Ridgebluff Ave
- 9699 Villa Lorena Ave
- 9862 Shadow Grove Ave
- 9748 Villa Lorena Ave
- 9472 W Diablo Dr
- 9794 Villa Lorena Ave
- 9571 Adobe Arch Ct
- 9587 Adobe Arch Ct
- 9580 Ancala Hollow Ct
- 9563 Adobe Arch Ct
- 9588 Ancala Hollow Ct
- 9578 Adobe Arch Ct
- 9564 Ancala Hollow Ct
- 9570 Adobe Arch Ct
- 9555 Adobe Arch Ct
- 9586 Adobe Arch Ct
- 9562 Adobe Arch Ct
- 9556 Ancala Hollow Ct Unit 1
- 9547 Adobe Arch Ct
- 9554 Adobe Arch Ct
- 5130 Zoroaster St
- 5124 Zoroaster St
- 5142 Zoroaster St
- 9548 Ancala Hollow Ct
- 5118 Zoroaster St