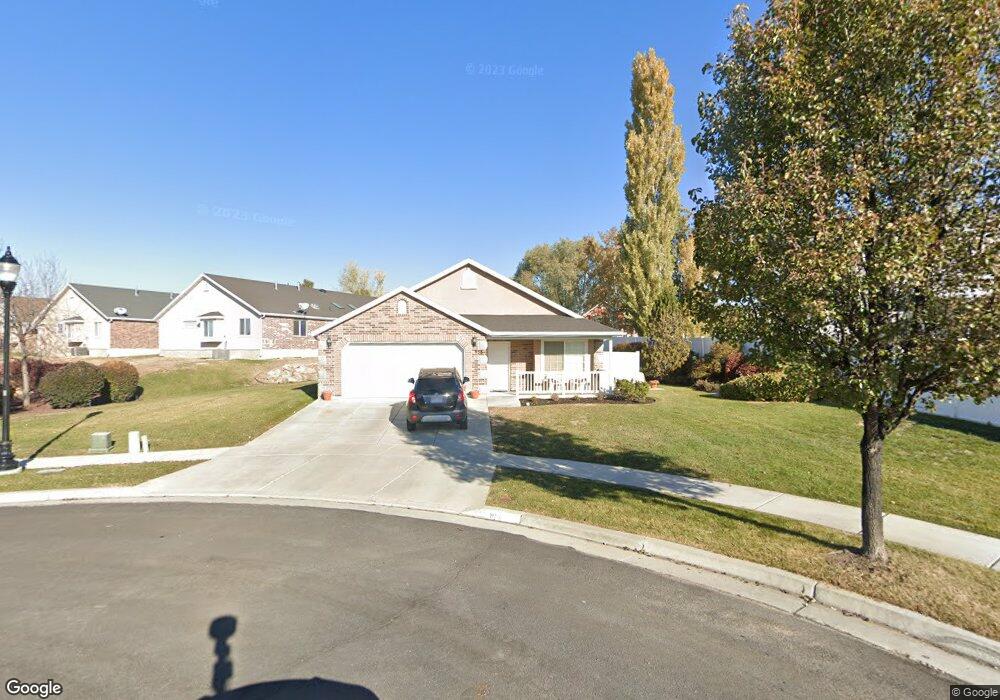
958 2250 N Unit 21 Layton, UT 84041
Estimated Value: $484,000 - $524,000
3
Beds
2
Baths
1,999
Sq Ft
$249/Sq Ft
Est. Value
About This Home
This home is located at 958 2250 N Unit 21, Layton, UT 84041 and is currently estimated at $498,149, approximately $249 per square foot. 958 2250 N Unit 21 is a home located in Davis County with nearby schools including Lincoln Elementary School, North Layton Junior High School, and Northridge High School.
Ownership History
Date
Name
Owned For
Owner Type
Purchase Details
Closed on
Mar 10, 2022
Sold by
Luana Fowers Family Trust
Bought by
Reinitz Michael S and Samaniego Jody M
Current Estimated Value
Home Financials for this Owner
Home Financials are based on the most recent Mortgage that was taken out on this home.
Original Mortgage
$490,000
Outstanding Balance
$456,997
Interest Rate
3.92%
Mortgage Type
VA
Estimated Equity
$41,152
Purchase Details
Closed on
Dec 12, 2006
Sold by
Colonial Builders Group Llc
Bought by
Fowers Launa G
Purchase Details
Closed on
May 17, 2006
Sold by
Greater Utah Land Investments Llc
Bought by
Colonial Builders Group Llc
Home Financials for this Owner
Home Financials are based on the most recent Mortgage that was taken out on this home.
Original Mortgage
$171,328
Interest Rate
6.41%
Mortgage Type
Purchase Money Mortgage
Create a Home Valuation Report for This Property
The Home Valuation Report is an in-depth analysis detailing your home's value as well as a comparison with similar homes in the area
Home Values in the Area
Average Home Value in this Area
Purchase History
| Date | Buyer | Sale Price | Title Company |
|---|---|---|---|
| Reinitz Michael S | -- | None Listed On Document | |
| Fowers Launa G | -- | Lincoln Title Insurance Agen | |
| Colonial Builders Group Llc | -- | Lincoln Title Ins Agency |
Source: Public Records
Mortgage History
| Date | Status | Borrower | Loan Amount |
|---|---|---|---|
| Open | Reinitz Michael S | $490,000 | |
| Previous Owner | Colonial Builders Group Llc | $171,328 |
Source: Public Records
Tax History Compared to Growth
Tax History
| Year | Tax Paid | Tax Assessment Tax Assessment Total Assessment is a certain percentage of the fair market value that is determined by local assessors to be the total taxable value of land and additions on the property. | Land | Improvement |
|---|---|---|---|---|
| 2024 | $2,479 | $259,600 | $52,250 | $207,350 |
| 2023 | $2,479 | $462,000 | $91,000 | $371,000 |
| 2022 | $2,581 | $261,250 | $45,650 | $215,600 |
| 2021 | $2,411 | $364,000 | $69,000 | $295,000 |
| 2020 | $2,182 | $316,000 | $51,000 | $265,000 |
| 2019 | $2,136 | $303,000 | $49,000 | $254,000 |
| 2018 | $1,980 | $282,000 | $49,000 | $233,000 |
| 2016 | $1,784 | $131,010 | $26,950 | $104,060 |
| 2015 | $1,765 | $123,090 | $26,950 | $96,140 |
| 2014 | $1,769 | $126,100 | $18,333 | $107,767 |
| 2013 | -- | $113,300 | $42,911 | $70,389 |
Source: Public Records
Map
Nearby Homes
- 781 W 2150 N
- 2402 N 725 W
- 2378 N 675 W
- 2211 N 525 W
- 2187 N 450 W
- 2887 N 1175 W
- 1094 N Angel St W
- 2949 N 1175 W
- 1837 N 440 W
- 2875 N Hill Field Rd Unit 58
- 2875 N Hill Field Rd Unit 17
- 2875 N Hill Field Rd Unit 62
- 1606 W 1960 N
- 1413 W 1650 N
- 709 W Highway 193
- 1615 N Angel St Unit E
- 1615 N Angel St Unit H
- 1615 N Angel St Unit I
- 1615 N Angel St Unit F
- 1615 N Angel St Unit G
- 958 W 2250 N Unit 21
- 973 Hidden Dr Unit 20
- 973 Hidden Dr
- 921 W 2275 N
- 986 W 2250 N Unit 10
- 986 W 2250 N
- 985 Hidden Dr
- 985 Hidden Dr Unit 19
- 985 Hidden Dr
- 2247 N 900 W
- 903 W 2275 N
- 2259 N 900 W
- 991 Hidden Dr Unit 18
- 991 W 2350 N
- 996 W 2250 N Unit 11
- 2233 N 900 W
- 961 W 2250 N Unit 9
- 961 W 2250 N
- 975 W 2250 N Unit 8
- 932 W 2275 N