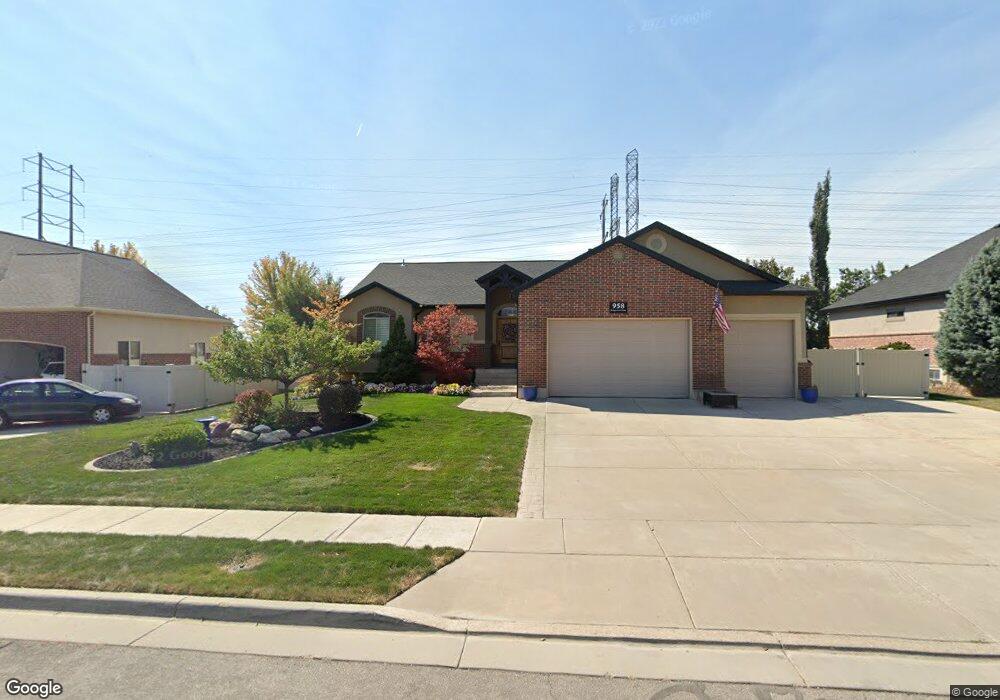
958 Bridgecreek Ln Layton, UT 84041
Estimated Value: $720,000 - $796,000
3
Beds
2
Baths
3,382
Sq Ft
$225/Sq Ft
Est. Value
About This Home
This home is located at 958 Bridgecreek Ln, Layton, UT 84041 and is currently estimated at $761,374, approximately $225 per square foot. 958 Bridgecreek Ln is a home located in Davis County with nearby schools including Heritage Elementary School, Shoreline Junior High School, and Layton High School.
Ownership History
Date
Name
Owned For
Owner Type
Purchase Details
Closed on
May 2, 2016
Sold by
Macfarlane Kim N
Bought by
Williams Kelly G and Williams Andrea L
Current Estimated Value
Purchase Details
Closed on
Aug 16, 2010
Sold by
Workman Lindsay J and Workman Mandi M
Bought by
Macfarlane Kim N
Home Financials for this Owner
Home Financials are based on the most recent Mortgage that was taken out on this home.
Original Mortgage
$270,018
Interest Rate
4.37%
Mortgage Type
FHA
Purchase Details
Closed on
Mar 14, 2006
Sold by
Workman Lindsay and Workman Mandi
Bought by
Workman Lindsay J and Workman Mandi M
Home Financials for this Owner
Home Financials are based on the most recent Mortgage that was taken out on this home.
Original Mortgage
$41,250
Interest Rate
5.78%
Mortgage Type
Stand Alone Second
Purchase Details
Closed on
Jul 27, 2004
Sold by
Ed Green Development Llc
Bought by
Workman Lindsay and Workman Mandi
Create a Home Valuation Report for This Property
The Home Valuation Report is an in-depth analysis detailing your home's value as well as a comparison with similar homes in the area
Home Values in the Area
Average Home Value in this Area
Purchase History
| Date | Buyer | Sale Price | Title Company |
|---|---|---|---|
| Williams Kelly G | -- | Pinnacle Title | |
| Macfarlane Kim N | -- | Inwest Title Services Inc | |
| Workman Lindsay J | -- | Pinnacle Title Ins Agency | |
| Workman Lindsay | -- | Security Title Company |
Source: Public Records
Mortgage History
| Date | Status | Borrower | Loan Amount |
|---|---|---|---|
| Previous Owner | Macfarlane Kim N | $270,018 | |
| Previous Owner | Workman Lindsay J | $41,250 | |
| Previous Owner | Workman Lindsay J | $220,000 |
Source: Public Records
Tax History Compared to Growth
Tax History
| Year | Tax Paid | Tax Assessment Tax Assessment Total Assessment is a certain percentage of the fair market value that is determined by local assessors to be the total taxable value of land and additions on the property. | Land | Improvement |
|---|---|---|---|---|
| 2025 | $3,202 | $336,050 | $118,244 | $217,806 |
| 2024 | $3,199 | $338,250 | $125,356 | $212,894 |
| 2023 | $3,144 | $586,000 | $135,178 | $450,822 |
| 2022 | $3,288 | $332,751 | $77,050 | $255,701 |
| 2021 | $2,975 | $449,000 | $115,544 | $333,456 |
| 2020 | $2,693 | $390,000 | $99,175 | $290,825 |
| 2019 | $2,580 | $366,000 | $96,933 | $269,067 |
| 2018 | $2,395 | $341,000 | $85,543 | $255,457 |
| 2016 | $2,229 | $163,735 | $42,472 | $121,263 |
| 2015 | $2,232 | $155,650 | $42,472 | $113,178 |
| 2014 | $2,301 | $164,092 | $42,472 | $121,620 |
| 2013 | -- | $151,030 | $39,264 | $111,766 |
Source: Public Records
Map
Nearby Homes
- 796 S Rock Creek Corner
- 920 S 1700 W Unit 1
- 1124 S Neville St
- 1234 S Grace Way
- 1278 S Grace Way
- 583 S Alberta Spruce Dr
- Creighton Farmhouse Plan at Angel Hill
- 1494 S Mica Ln
- 1042 W Shoreline Dr
- 557 S Angel St
- 2182 W Evergreen Way Unit 143
- 1038 S Old Towne Rd
- 1910 W Bonneville Ln
- 2056 W Phillips St
- 774 W Farming Way
- 562 S 850 W
- 233 Heathermoor Ln
- 1015 W 350 S
- Aspen Plan at West Gate
- Eleanor Plan at West Gate
- 958 S Bridge Creek Ln W
- 946 Bridgecreek Ln
- 972 Bridgecreek Ln
- 932 Bridgecreek Ln
- 932 Bridgecreek Ln Unit 502
- 1605 W Timbercreek Ln
- 974 Bridgecreek Ln
- 998 S Bridge Creek Ln W
- 918 S Bridge Creek Ln W
- 1572 W 975 S
- 918 Bridgecreek Ln
- 918 Bridgecreek Ln Unit 503
- 1591 W Timbercreek Ln
- 998 Bridgecreek Ln
- 1612 W Timbercreek Ln
- 1556 W 975 S
- 1598 W Timbercreek Ln
- 1565 W 975 S
- 1577 W Timbercreek Ln
- 1577 W Timbercreek Ln