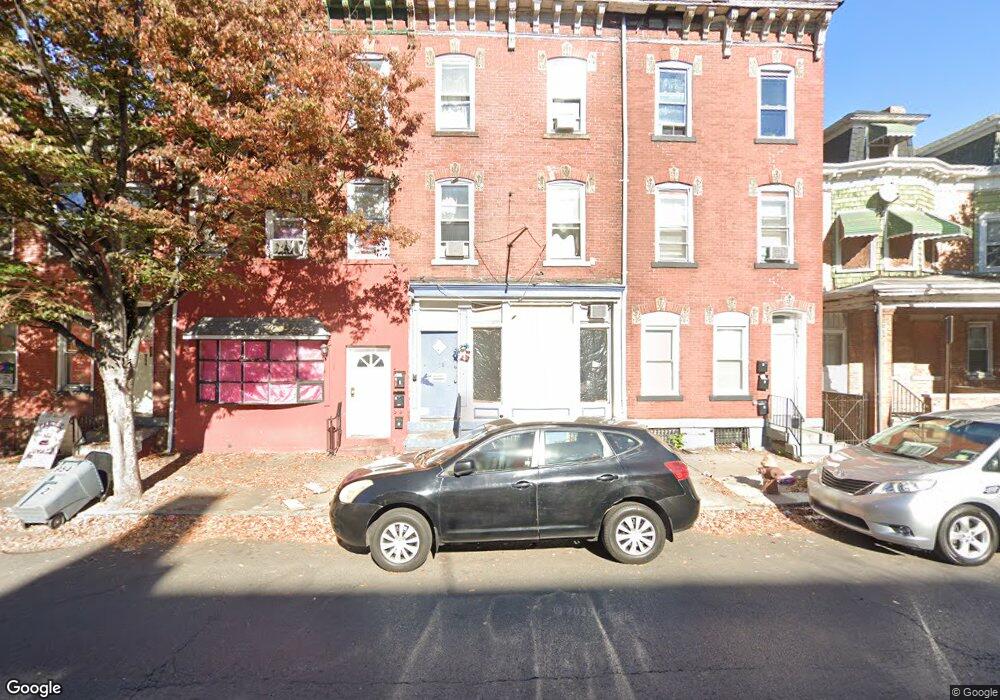
958 S Broad St Trenton, NJ 08611
Chambersburg NeighborhoodEstimated Value: $224,575 - $333,000
--
Bed
--
Bath
2,032
Sq Ft
$140/Sq Ft
Est. Value
About This Home
This home is located at 958 S Broad St, Trenton, NJ 08611 and is currently estimated at $284,644, approximately $140 per square foot. 958 S Broad St is a home located in Mercer County with nearby schools including Harrison Elementary School, Monument Elementary School, and Dr. Crosby Copeland Elementary School.
Ownership History
Date
Name
Owned For
Owner Type
Purchase Details
Closed on
Apr 8, 2004
Sold by
Gonzalez Angel
Bought by
Santos Hector De Los
Current Estimated Value
Home Financials for this Owner
Home Financials are based on the most recent Mortgage that was taken out on this home.
Original Mortgage
$142,759
Interest Rate
5.94%
Mortgage Type
FHA
Purchase Details
Closed on
Sep 22, 1995
Sold by
Tunis Laura
Bought by
Gonzalez Angel and Gonzalez Rosa
Home Financials for this Owner
Home Financials are based on the most recent Mortgage that was taken out on this home.
Original Mortgage
$49,000
Interest Rate
7.89%
Mortgage Type
FHA
Create a Home Valuation Report for This Property
The Home Valuation Report is an in-depth analysis detailing your home's value as well as a comparison with similar homes in the area
Home Values in the Area
Average Home Value in this Area
Purchase History
| Date | Buyer | Sale Price | Title Company |
|---|---|---|---|
| Santos Hector De Los | $145,000 | -- | |
| Gonzalez Angel | $49,000 | -- |
Source: Public Records
Mortgage History
| Date | Status | Borrower | Loan Amount |
|---|---|---|---|
| Previous Owner | Santos Hector De Los | $142,759 | |
| Previous Owner | Gonzalez Angel | $49,000 |
Source: Public Records
Tax History Compared to Growth
Tax History
| Year | Tax Paid | Tax Assessment Tax Assessment Total Assessment is a certain percentage of the fair market value that is determined by local assessors to be the total taxable value of land and additions on the property. | Land | Improvement |
|---|---|---|---|---|
| 2025 | $4,502 | $77,600 | $7,100 | $70,500 |
| 2024 | $4,320 | $77,600 | $7,100 | $70,500 |
| 2023 | $4,320 | $77,600 | $7,100 | $70,500 |
| 2022 | $4,235 | $77,600 | $7,100 | $70,500 |
| 2021 | $4,309 | $77,600 | $7,100 | $70,500 |
| 2020 | $4,295 | $77,600 | $7,100 | $70,500 |
| 2019 | $4,226 | $77,600 | $7,100 | $70,500 |
| 2018 | $4,045 | $77,600 | $7,100 | $70,500 |
| 2017 | $3,845 | $77,600 | $7,100 | $70,500 |
| 2016 | $5,442 | $94,600 | $17,600 | $77,000 |
| 2015 | $5,423 | $94,600 | $17,600 | $77,000 |
| 2014 | $5,398 | $94,600 | $17,600 | $77,000 |
Source: Public Records
Map
Nearby Homes