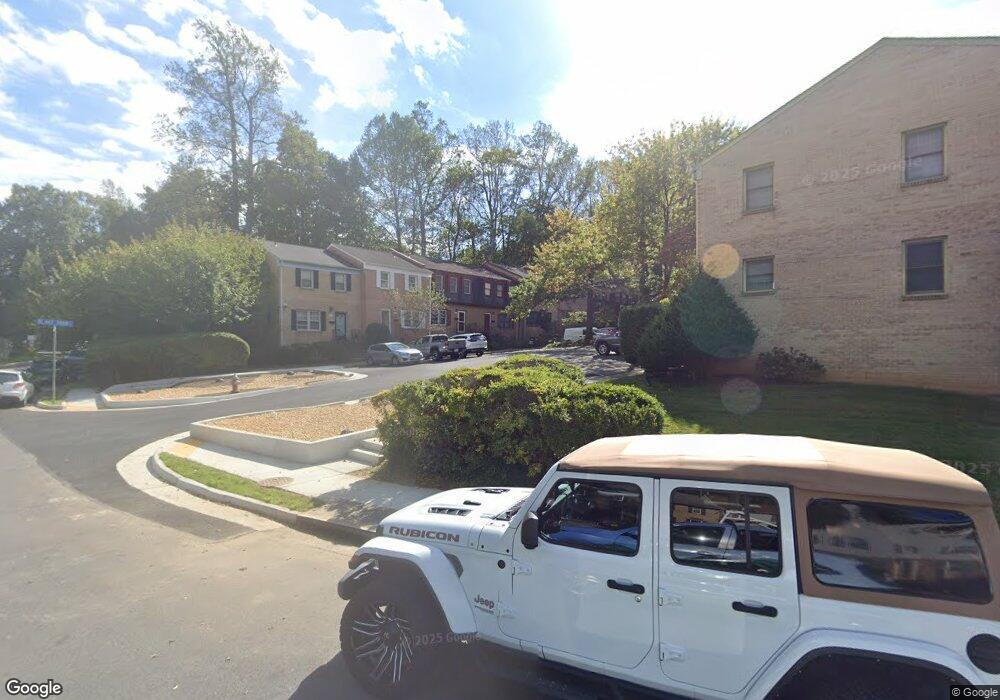
9581 Blake Park Ct Fairfax, VA 22031
Estimated Value: $280,000 - $605,000
3
Beds
3
Baths
1,320
Sq Ft
$391/Sq Ft
Est. Value
About This Home
This home is located at 9581 Blake Park Ct, Fairfax, VA 22031 and is currently estimated at $515,795, approximately $390 per square foot. 9581 Blake Park Ct is a home located in Fairfax County with nearby schools including Mosby Woods Elementary School, Thoreau Middle School, and Appletree School.
Ownership History
Date
Name
Owned For
Owner Type
Purchase Details
Closed on
Sep 23, 2016
Sold by
El Mulla Cinnamon
Bought by
El Mulla Cinnamon and El Mulla Samih
Current Estimated Value
Home Financials for this Owner
Home Financials are based on the most recent Mortgage that was taken out on this home.
Original Mortgage
$630,000
Outstanding Balance
$612,843
Interest Rate
3.43%
Mortgage Type
Reverse Mortgage Home Equity Conversion Mortgage
Estimated Equity
-$97,048
Purchase Details
Closed on
Dec 22, 1998
Sold by
Wright Charles K
Bought by
El-Mulla Cinnamon
Home Financials for this Owner
Home Financials are based on the most recent Mortgage that was taken out on this home.
Original Mortgage
$144,750
Interest Rate
6.89%
Create a Home Valuation Report for This Property
The Home Valuation Report is an in-depth analysis detailing your home's value as well as a comparison with similar homes in the area
Home Values in the Area
Average Home Value in this Area
Purchase History
| Date | Buyer | Sale Price | Title Company |
|---|---|---|---|
| El Mulla Cinnamon | -- | None Available | |
| El-Mulla Cinnamon | $146,000 | -- |
Source: Public Records
Mortgage History
| Date | Status | Borrower | Loan Amount |
|---|---|---|---|
| Open | El Mulla Cinnamon | $630,000 | |
| Previous Owner | El-Mulla Cinnamon | $144,750 |
Source: Public Records
Tax History Compared to Growth
Tax History
| Year | Tax Paid | Tax Assessment Tax Assessment Total Assessment is a certain percentage of the fair market value that is determined by local assessors to be the total taxable value of land and additions on the property. | Land | Improvement |
|---|---|---|---|---|
| 2025 | -- | $590,500 | $160,000 | $430,500 |
| 2024 | $6,356 | $548,600 | $145,000 | $403,600 |
| 2023 | $5,866 | $519,770 | $145,000 | $374,770 |
| 2022 | $5,678 | $496,580 | $135,000 | $361,580 |
| 2021 | $0 | $456,390 | $120,000 | $336,390 |
| 2020 | $5,604 | $421,340 | $110,000 | $311,340 |
| 2019 | $5,524 | $415,340 | $104,000 | $311,340 |
| 2018 | $4,730 | $411,340 | $100,000 | $311,340 |
| 2017 | $4,456 | $397,260 | $89,000 | $308,260 |
| 2016 | $4,340 | $374,580 | $81,000 | $293,580 |
| 2015 | $4,180 | $374,580 | $81,000 | $293,580 |
| 2014 | $3,960 | $355,600 | $76,000 | $279,600 |
Source: Public Records
Map
Nearby Homes
- 3003 Mission Square Dr
- 9606 Blake Ln
- 0 Blake Ln Blake Ln Service Rd Unit VAFX2167468
- 3054 Mission Square Dr
- 2960 Vaden Dr Unit 2-406
- 2960 Vaden Dr Unit 2-307
- 2960 Vaden Dr Unit 2-312
- 2960 Vaden Dr Unit 413
- 3033 White Birch Ct
- 3065 White Birch Ct
- 2903 Saintsbury Plaza Unit 310
- 2903 Saintsbury Plaza Unit 405
- 2905 Saintsbury Plaza Unit 312
- 9713 Kings Crown Ct Unit 1
- 9523 Bastille St Unit 207
- 9555 Saintsbury Dr Unit 503
- 9652 Pullman Place
- 9730 Kingsbridge Dr Unit 202
- 9715 Kings Crown Ct Unit 202
- 9720 Five Oaks Rd
- 9579 Blake Park Ct
- 9583 Blake Park Ct
- 9577 Blake Park Ct
- 9585 Blake Park Ct
- 9575 Blake Park Ct
- 9575 Blake Park Ct
- 9587 Blake Park Ct
- 9589 Blake Park Ct
- 9573 Blake Park Ct
- 2997 Mission Square Dr
- 2999 Mission Square Dr
- 2995 Mission Square Dr
- 9591 Blake Park Ct
- 2993 Mission Square Dr
- 9599 Blake Park Ct
- 2991 Mission Square Dr
- 2989 Mission Square Dr
- 9595 Blake Park Ct
- 9597 Blake Park Ct
- 9615 Lindenbrook St