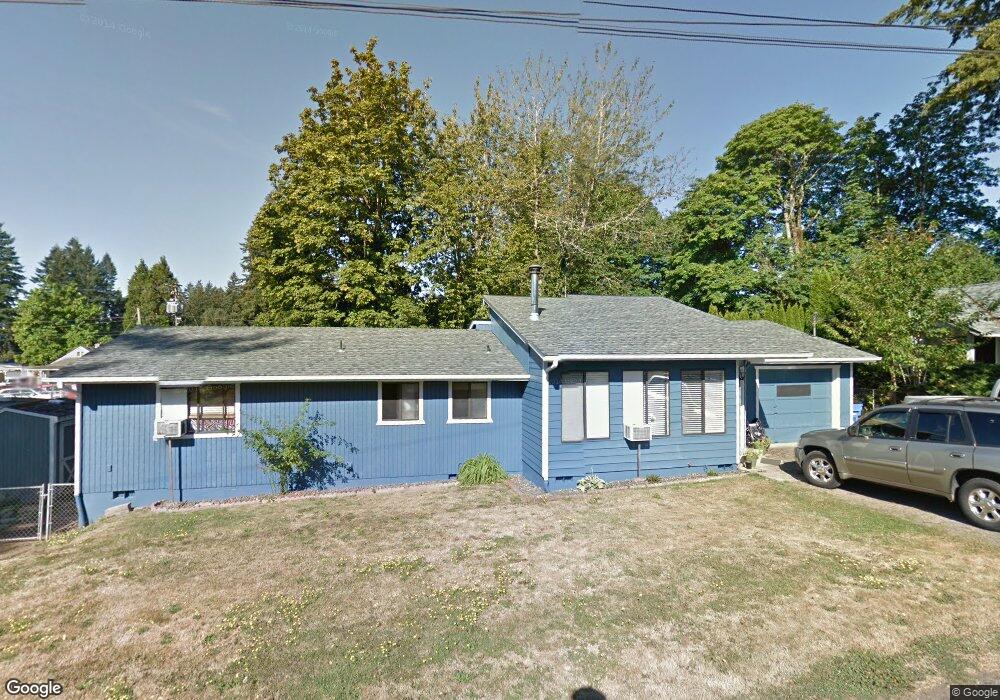
959 28th Ct Washougal, WA 98671
Estimated Value: $437,000 - $487,000
3
Beds
1
Bath
1,392
Sq Ft
$331/Sq Ft
Est. Value
About This Home
This home is located at 959 28th Ct, Washougal, WA 98671 and is currently estimated at $460,231, approximately $330 per square foot. 959 28th Ct is a home located in Clark County with nearby schools including Gause Elementary School, Jemtegaard Middle School, and Washougal High School.
Ownership History
Date
Name
Owned For
Owner Type
Purchase Details
Closed on
Sep 30, 2015
Sold by
Collins Samuel G and Collins Sarah
Bought by
Holtman Stephanie C
Current Estimated Value
Home Financials for this Owner
Home Financials are based on the most recent Mortgage that was taken out on this home.
Original Mortgage
$227,448
Outstanding Balance
$179,015
Interest Rate
3.89%
Mortgage Type
New Conventional
Estimated Equity
$281,216
Purchase Details
Closed on
Sep 26, 2003
Sold by
Collins Tara
Bought by
Collins Samuel G
Home Financials for this Owner
Home Financials are based on the most recent Mortgage that was taken out on this home.
Original Mortgage
$144,050
Interest Rate
6.17%
Mortgage Type
Purchase Money Mortgage
Create a Home Valuation Report for This Property
The Home Valuation Report is an in-depth analysis detailing your home's value as well as a comparison with similar homes in the area
Home Values in the Area
Average Home Value in this Area
Purchase History
| Date | Buyer | Sale Price | Title Company |
|---|---|---|---|
| Holtman Stephanie C | $222,900 | Chicago Title Fl Vancouver | |
| Collins Samuel G | -- | Chicago Title Insurance | |
| Collins Samuel G | $168,692 | Chicago Title Insurance |
Source: Public Records
Mortgage History
| Date | Status | Borrower | Loan Amount |
|---|---|---|---|
| Open | Holtman Stephanie C | $227,448 | |
| Previous Owner | Collins Samuel G | $144,050 |
Source: Public Records
Tax History Compared to Growth
Tax History
| Year | Tax Paid | Tax Assessment Tax Assessment Total Assessment is a certain percentage of the fair market value that is determined by local assessors to be the total taxable value of land and additions on the property. | Land | Improvement |
|---|---|---|---|---|
| 2025 | $3,647 | $333,892 | $119,639 | $214,253 |
| 2024 | $3,522 | $384,243 | $165,102 | $219,141 |
| 2023 | $3,366 | $388,279 | $165,102 | $223,177 |
| 2022 | $3,393 | $363,402 | $157,923 | $205,479 |
| 2021 | $3,223 | $317,858 | $138,781 | $179,077 |
| 2020 | $2,926 | $283,368 | $125,621 | $157,747 |
| 2019 | $2,542 | $261,327 | $119,639 | $141,688 |
| 2018 | $2,769 | $240,011 | $0 | $0 |
| 2017 | $2,290 | $215,820 | $0 | $0 |
| 2016 | $2,138 | $196,046 | $0 | $0 |
| 2015 | $1,964 | $167,368 | $0 | $0 |
| 2014 | -- | $152,902 | $0 | $0 |
| 2013 | -- | $134,883 | $0 | $0 |
Source: Public Records
Map
Nearby Homes