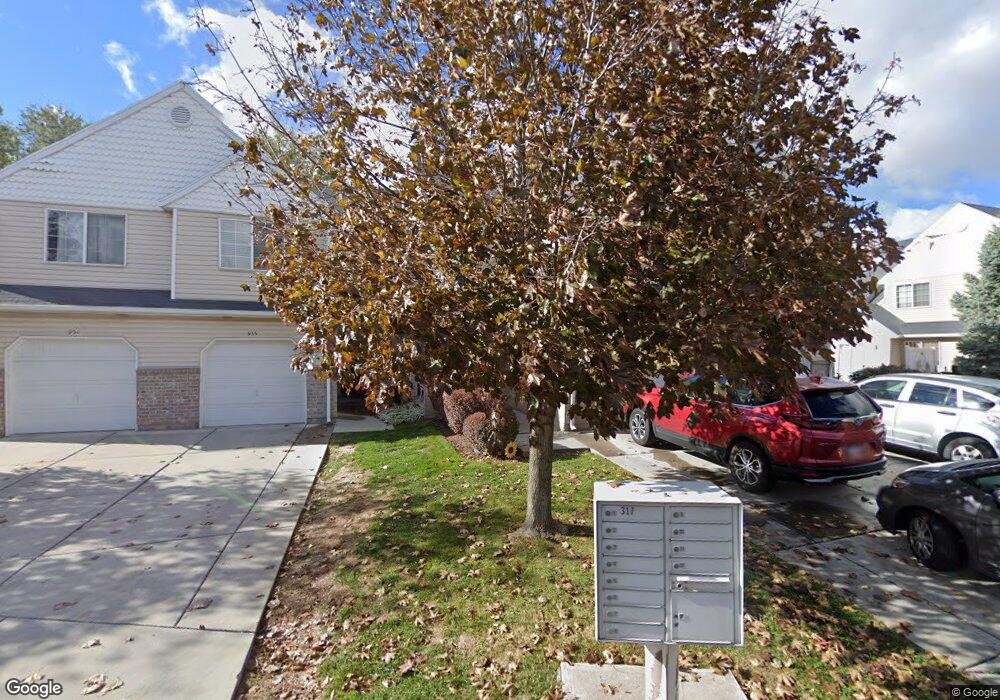
959 N 1125 W Layton, UT 84041
Estimated Value: $339,000 - $392,000
3
Beds
3
Baths
1,400
Sq Ft
$259/Sq Ft
Est. Value
About This Home
This home is located at 959 N 1125 W, Layton, UT 84041 and is currently estimated at $362,479, approximately $258 per square foot. 959 N 1125 W is a home located in Davis County with nearby schools including Central Davis Junior High School, Layton High School, and North Davis Preparatory Academy.
Ownership History
Date
Name
Owned For
Owner Type
Purchase Details
Closed on
Jun 15, 2020
Sold by
Hover Kay Lynn and The Kay Hover Revocable Trust
Bought by
Hover Kay Lynn and Hover Jamie Lynn
Current Estimated Value
Home Financials for this Owner
Home Financials are based on the most recent Mortgage that was taken out on this home.
Original Mortgage
$93,000
Outstanding Balance
$82,255
Interest Rate
3.2%
Mortgage Type
New Conventional
Estimated Equity
$280,224
Purchase Details
Closed on
Apr 25, 2018
Sold by
Hover Kay L
Bought by
Hover Kay Lynn and Hover Revocable Trust
Purchase Details
Closed on
Apr 21, 2003
Sold by
Legacy Village Llc
Bought by
Hover Kay L
Home Financials for this Owner
Home Financials are based on the most recent Mortgage that was taken out on this home.
Original Mortgage
$117,450
Interest Rate
5.6%
Mortgage Type
FHA
Create a Home Valuation Report for This Property
The Home Valuation Report is an in-depth analysis detailing your home's value as well as a comparison with similar homes in the area
Home Values in the Area
Average Home Value in this Area
Purchase History
| Date | Buyer | Sale Price | Title Company |
|---|---|---|---|
| Hover Kay Lynn | -- | First American Title | |
| Hover Kay Lynn | -- | None Available | |
| Hover Kay L | -- | Bonneville Title Company Inc |
Source: Public Records
Mortgage History
| Date | Status | Borrower | Loan Amount |
|---|---|---|---|
| Open | Hover Kay Lynn | $93,000 | |
| Previous Owner | Hover Kay L | $117,450 | |
| Closed | Hover Kay L | $3,000 |
Source: Public Records
Tax History Compared to Growth
Tax History
| Year | Tax Paid | Tax Assessment Tax Assessment Total Assessment is a certain percentage of the fair market value that is determined by local assessors to be the total taxable value of land and additions on the property. | Land | Improvement |
|---|---|---|---|---|
| 2025 | $1,633 | $174,350 | $57,200 | $117,150 |
| 2024 | $1,633 | $172,700 | $43,450 | $129,250 |
| 2023 | $1,615 | $301,000 | $76,000 | $225,000 |
| 2022 | $1,630 | $165,000 | $40,150 | $124,850 |
| 2021 | $1,510 | $228,000 | $60,000 | $168,000 |
| 2020 | $1,450 | $210,000 | $58,800 | $151,200 |
| 2019 | $1,389 | $197,000 | $56,500 | $140,500 |
| 2018 | $1,194 | $170,000 | $50,000 | $120,000 |
| 2016 | $994 | $72,985 | $15,400 | $57,585 |
| 2015 | $1,012 | $70,565 | $15,400 | $55,165 |
| 2014 | $1,024 | $73,032 | $18,333 | $54,699 |
| 2013 | -- | $74,645 | $15,400 | $59,245 |
Source: Public Records
Map
Nearby Homes
- 1171 W Gordon Ave
- 1113 W Angel Hill Ct
- 1259 W 1050 N
- 1366 N Main St Unit 5
- 1677 N 1600 W Unit 134
- 1133 Laytona Dr
- 1254 Marilyn Dr
- 1187 W Seraphim Ct
- 1500 N Angel St Unit 12
- 1500 N Angel St Unit 64
- 1456 Scott Cir
- 526 King St Unit 2
- 1615 N Angel St Unit F
- 1615 N Angel St Unit I
- 1615 N Angel St Unit E
- 1615 N Angel St Unit B
- 1615 N Angel St
- 1615 N Angel St Unit C
- 1615 N Angel St Unit H
- 1615 N Angel St Unit A