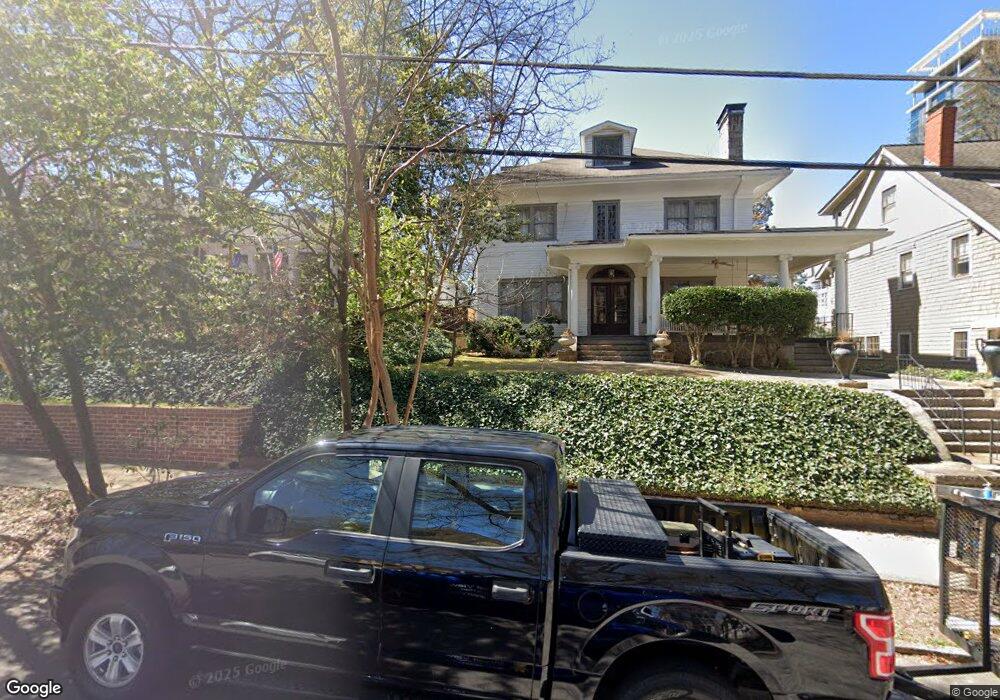
959 Piedmont Ave NE Unit A Atlanta, GA 30309
Midtown Atlanta NeighborhoodEstimated Value: $518,785 - $571,000
3
Beds
3
Baths
1,400
Sq Ft
$386/Sq Ft
Est. Value
About This Home
This home is located at 959 Piedmont Ave NE Unit A, Atlanta, GA 30309 and is currently estimated at $540,696, approximately $386 per square foot. 959 Piedmont Ave NE Unit A is a home located in Fulton County with nearby schools including Midtown High School, Kindezi Old 4th Ward, and Centennial Academy.
Ownership History
Date
Name
Owned For
Owner Type
Purchase Details
Closed on
Apr 25, 2008
Sold by
Erasmus Johan
Bought by
Swords Stacy
Current Estimated Value
Home Financials for this Owner
Home Financials are based on the most recent Mortgage that was taken out on this home.
Original Mortgage
$296,000
Outstanding Balance
$186,866
Interest Rate
5.82%
Mortgage Type
New Conventional
Estimated Equity
$353,830
Purchase Details
Closed on
Feb 27, 2002
Sold by
Ronan David T
Bought by
Erasmus Johan
Home Financials for this Owner
Home Financials are based on the most recent Mortgage that was taken out on this home.
Original Mortgage
$199,200
Interest Rate
7.12%
Mortgage Type
New Conventional
Purchase Details
Closed on
Aug 11, 1997
Sold by
Bronk H Douglas
Bought by
Munroe Twuanna M
Home Financials for this Owner
Home Financials are based on the most recent Mortgage that was taken out on this home.
Original Mortgage
$161,400
Interest Rate
7.52%
Mortgage Type
New Conventional
Create a Home Valuation Report for This Property
The Home Valuation Report is an in-depth analysis detailing your home's value as well as a comparison with similar homes in the area
Home Values in the Area
Average Home Value in this Area
Purchase History
| Date | Buyer | Sale Price | Title Company |
|---|---|---|---|
| Swords Stacy | $370,000 | -- | |
| Erasmus Johan | $249,000 | -- | |
| Munroe Twuanna M | $169,900 | -- |
Source: Public Records
Mortgage History
| Date | Status | Borrower | Loan Amount |
|---|---|---|---|
| Open | Swords Stacy | $296,000 | |
| Previous Owner | Erasmus Johan | $199,200 | |
| Previous Owner | Munroe Twuanna M | $161,400 |
Source: Public Records
Tax History Compared to Growth
Tax History
| Year | Tax Paid | Tax Assessment Tax Assessment Total Assessment is a certain percentage of the fair market value that is determined by local assessors to be the total taxable value of land and additions on the property. | Land | Improvement |
|---|---|---|---|---|
| 2025 | $4,458 | $235,280 | $28,480 | $206,800 |
| 2023 | $6,197 | $149,680 | $45,520 | $104,160 |
| 2022 | $4,030 | $149,680 | $45,520 | $104,160 |
| 2021 | $3,328 | $121,360 | $15,360 | $106,000 |
| 2020 | $3,297 | $119,920 | $15,160 | $104,760 |
| 2019 | $343 | $117,800 | $14,880 | $102,920 |
| 2018 | $3,563 | $115,040 | $14,560 | $100,480 |
| 2017 | $3,535 | $110,640 | $14,000 | $96,640 |
| 2016 | $3,544 | $110,640 | $14,000 | $96,640 |
| 2015 | $3,785 | $110,640 | $14,000 | $96,640 |
| 2014 | -- | $110,640 | $14,000 | $96,640 |
Source: Public Records
Map
Nearby Homes
- 916 Myrtle St NE Unit 1
- 955 Juniper St NE Unit 4027
- 955 Juniper St NE Unit 2315
- 955 Juniper St NE Unit 2215
- 955 Juniper St NE Unit 4112
- 955 Juniper St NE Unit 4324
- 955 Juniper St NE Unit 1317
- 955 Juniper St NE Unit 4127
- 955 Juniper St NE Unit 3331
- 955 Juniper St NE Unit 2322
- 955 Juniper St NE Unit 3026
- 955 Juniper St NE Unit 4331
- 1029 Piedmont Ave NE Unit 303
- 1023 Juniper St NE Unit 203
- 206 11th St NE Unit 703
- 206 11th St NE Unit 205
- 893 Piedmont Ave NE Unit 5
- 959 Piedmont Ave NE Unit B
- 959 Piedmont Ave NE Unit A
- 957 Piedmont Ave NE
- 961 Piedmont Ave NE Unit A
- 961 Piedmont Ave NE Unit 961
- 961 Piedmont Ave NE
- 963 Piedmont Ave NE
- 963 Piedmont Ave NE Unit A
- 963 Piedmont Ave NE Unit B
- 951 Piedmont Ave NE
- 969 Piedmont Ave NE
- 945 Piedmont Ave NE
- 971 Piedmont Ave NE
- 956 Myrtle St NE
- 962 Myrtle St NE
- 952 Myrtle St NE
- 952 Myrtle St NE Unit 3
- 952 Myrtle St NE Unit 1
- 975 Piedmont Ave NE
- 975 Piedmont Ave NE Unit 4