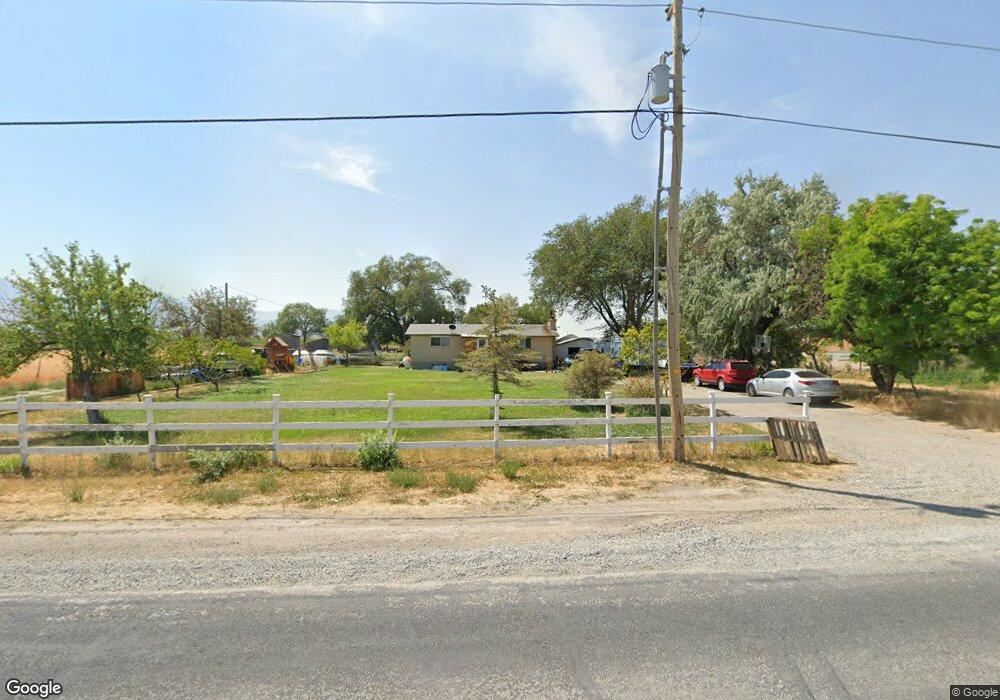
959 W Erda Way Tooele, UT 84074
Estimated Value: $580,974 - $769,000
--
Bed
--
Bath
2,422
Sq Ft
$271/Sq Ft
Est. Value
About This Home
This home is located at 959 W Erda Way, Tooele, UT 84074 and is currently estimated at $655,244, approximately $270 per square foot. 959 W Erda Way is a home with nearby schools including Overlake Elementary School, Clarke N. Johnsen Junior High School, and Stansbury High School.
Ownership History
Date
Name
Owned For
Owner Type
Purchase Details
Closed on
Feb 24, 2022
Sold by
Jcook Holdings Llc
Bought by
Cook Benjamin and Cook Brenda D
Current Estimated Value
Purchase Details
Closed on
Apr 24, 2015
Sold by
Barabochkine Jana Louise and Ebert Linda Gay
Bought by
Jcook Holdings Llc
Purchase Details
Closed on
Jul 25, 2011
Sold by
Cook Janet M
Bought by
Cook Janet M and The Janet M Cook Living Trust
Purchase Details
Closed on
Jul 29, 2010
Sold by
Cook George V and Cook George Victor
Bought by
Barabochkine Vassili V and Barabochkine Jana L
Purchase Details
Closed on
Jul 27, 2010
Sold by
Cook George V and Cook George Victor
Bought by
Cook George and Cook Janet M
Create a Home Valuation Report for This Property
The Home Valuation Report is an in-depth analysis detailing your home's value as well as a comparison with similar homes in the area
Home Values in the Area
Average Home Value in this Area
Purchase History
| Date | Buyer | Sale Price | Title Company |
|---|---|---|---|
| Cook Benjamin | -- | First American Title | |
| Jcook Holdings Llc | -- | None Available | |
| Cook Janet M | -- | None Available | |
| Barabochkine Vassili V | -- | None Available | |
| Cook George | -- | None Available |
Source: Public Records
Tax History Compared to Growth
Tax History
| Year | Tax Paid | Tax Assessment Tax Assessment Total Assessment is a certain percentage of the fair market value that is determined by local assessors to be the total taxable value of land and additions on the property. | Land | Improvement |
|---|---|---|---|---|
| 2025 | $3,556 | $547,548 | $258,060 | $289,488 |
| 2024 | $3,509 | $279,482 | $150,060 | $129,422 |
| 2023 | $3,509 | $301,841 | $129,540 | $172,301 |
| 2022 | $3,324 | $301,597 | $145,080 | $156,517 |
| 2021 | $2,560 | $194,914 | $77,700 | $117,214 |
| 2020 | $2,474 | $314,251 | $98,800 | $215,451 |
| 2019 | $2,334 | $291,866 | $98,800 | $193,066 |
| 2018 | $2,215 | $260,776 | $98,800 | $161,976 |
| 2017 | $1,833 | $229,686 | $98,800 | $130,886 |
| 2016 | $1,247 | $132,218 | $60,550 | $71,668 |
| 2015 | $1,247 | $93,072 | $0 | $0 |
| 2014 | -- | $93,072 | $0 | $0 |
Source: Public Records
Map
Nearby Homes
- 3949 Rose Springs Rd
- 4104 Rose Springs Rd
- 4311 N Diamond Ln
- Oakley Plan at Riley Park
- 562 W Erda Way
- Providence Plan at Riley Park
- Rochester Plan at Riley Park
- 3908 Campbell Rd
- 3799 Campbell Rd
- 3732 Campbell Rd
- 747 W Charley Way
- 431 W 3460 N
- 379 W Church Rd
- 81 W Hummingbird Ln
- 4781 N Selma Way
- 4328 Palmer Rd
- 5212 Roma Ln
- 5258 Ponderosa Ln
- 5246 Roma Ln
- 4796 Utah 36
- 985 W Erda Way
- 909 W Erda Way
- 954 W Erda Way
- 954 W Erda Way Unit 2
- 954 W Erda Way Unit 2
- 916 W Erda Way
- 932 W Erda Way
- 932 W Erda Way Unit 3
- 932 W Erda Way
- 888 W Erda Way
- 868 W Erda Way
- 848 W Erda Way
- 848 W Erda Way Unit 3C
- 818 W Erda Way
- 881 W Erda Way
- 1110 W Erda Way
- 4019 Rose Springs Rd
- 4019 Rose Springs Rd
- 1144 W Erda Way
- 3979 Rose Springs Rd