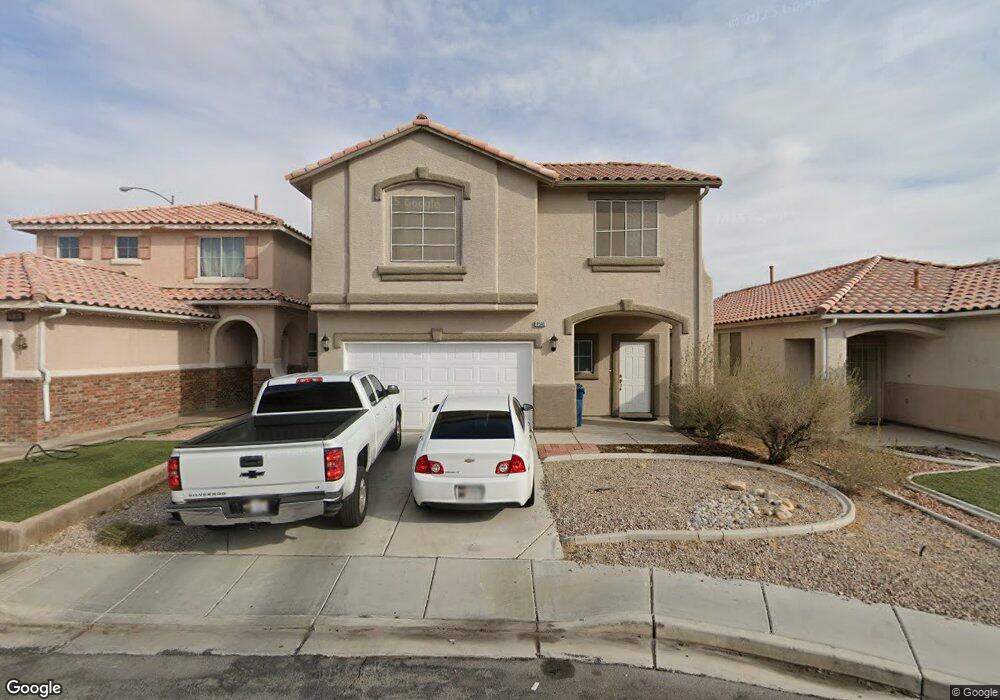
9590 Sunshade Ct Las Vegas, NV 89147
Rancho Viejo NeighborhoodEstimated Value: $425,000 - $431,000
3
Beds
3
Baths
1,527
Sq Ft
$280/Sq Ft
Est. Value
About This Home
This home is located at 9590 Sunshade Ct, Las Vegas, NV 89147 and is currently estimated at $426,825, approximately $279 per square foot. 9590 Sunshade Ct is a home located in Clark County with nearby schools including Keith C. & Karen W. Hayes Elementary School, Victoria Fertitta Middle School, and Spring Valley High School.
Ownership History
Date
Name
Owned For
Owner Type
Purchase Details
Closed on
Dec 27, 2006
Sold by
Filler Judith K
Bought by
Mcclaney La Doris and La Doris Mcclaney Family Trust
Current Estimated Value
Home Financials for this Owner
Home Financials are based on the most recent Mortgage that was taken out on this home.
Original Mortgage
$224,000
Outstanding Balance
$131,313
Interest Rate
5.87%
Mortgage Type
Unknown
Estimated Equity
$295,512
Purchase Details
Closed on
Oct 9, 2006
Sold by
Filler Judith K
Bought by
Filler Judith K and Judy Filler Trust
Purchase Details
Closed on
Feb 17, 2000
Sold by
Kaufman & Broad Of Nevada Inc
Bought by
Filler Judith K
Home Financials for this Owner
Home Financials are based on the most recent Mortgage that was taken out on this home.
Original Mortgage
$119,000
Interest Rate
8.14%
Create a Home Valuation Report for This Property
The Home Valuation Report is an in-depth analysis detailing your home's value as well as a comparison with similar homes in the area
Home Values in the Area
Average Home Value in this Area
Purchase History
| Date | Buyer | Sale Price | Title Company |
|---|---|---|---|
| Mcclaney La Doris | $280,000 | Equity Title Of Nevada | |
| Filler Judith K | -- | None Available | |
| Filler Judith K | $137,380 | First American Title Co |
Source: Public Records
Mortgage History
| Date | Status | Borrower | Loan Amount |
|---|---|---|---|
| Open | Mcclaney La Doris | $224,000 | |
| Previous Owner | Filler Judith K | $119,000 |
Source: Public Records
Tax History Compared to Growth
Tax History
| Year | Tax Paid | Tax Assessment Tax Assessment Total Assessment is a certain percentage of the fair market value that is determined by local assessors to be the total taxable value of land and additions on the property. | Land | Improvement |
|---|---|---|---|---|
| 2025 | $1,997 | $99,998 | $41,300 | $58,698 |
| 2024 | $1,939 | $99,998 | $41,300 | $58,698 |
| 2023 | $1,354 | $91,949 | $36,400 | $55,549 |
| 2022 | $1,883 | $80,939 | $30,100 | $50,839 |
| 2021 | $1,744 | $74,322 | $25,900 | $48,422 |
| 2020 | $1,616 | $72,552 | $24,500 | $48,052 |
| 2019 | $1,515 | $70,041 | $22,750 | $47,291 |
| 2018 | $1,445 | $63,594 | $18,200 | $45,394 |
| 2017 | $1,851 | $63,124 | $17,150 | $45,974 |
| 2016 | $1,354 | $57,518 | $11,550 | $45,968 |
| 2015 | $1,350 | $47,575 | $10,850 | $36,725 |
| 2014 | $1,308 | $43,275 | $9,800 | $33,475 |
Source: Public Records
Map
Nearby Homes
- 9545 Canyonland Ct
- 3580 Teton Hills St
- 9475 Sand Villa Ct
- 9605 Rainfall Ave
- 3757 Horseshoe Mesa St
- 9485 Camino Capistrano Ln Unit 1
- 9750 W Cherokee Ave Unit 1
- 9500 Catalina Cove Cir
- 9718 Camino Capistrano Ln
- 9506 Teton Diablo Ave
- 9615 Sedona Hills Ct
- 9758 Camino Capistrano Ln
- 9750 Pine Thickett Ave
- 9514 Teton Vista Ave
- 9591 Borgata Bay Blvd
- 9376 Peace Pipe Ct
- 3559 S Dapple Gray Rd
- 9785 Turtle Head Ct
- 3891 Lilac Haze St
- 9334 Peace Pipe Ct
- 9584 Sunshade Ct
- 9578 Sunshade Ct
- 9591 Sun Drop Ct
- 9585 Sun Drop Ct
- 9597 Sun Drop Ct
- 9572 Sunshade Ct
- 9579 Sun Drop Ct
- 9597 Sunshade Ct
- 9573 Sun Drop Ct
- 9591 Sunshade Ct
- 9566 Sunshade Ct
- 9585 Sunshade Ct Unit n/a
- 9585 Sunshade Ct
- 9579 Sunshade Ct
- 9567 Sun Drop Ct
- 9567 Sun Drop Ct
- 9573 Sunshade Ct
- 9560 Sunshade Ct
- 9560 Sunshade Ct Unit n/a