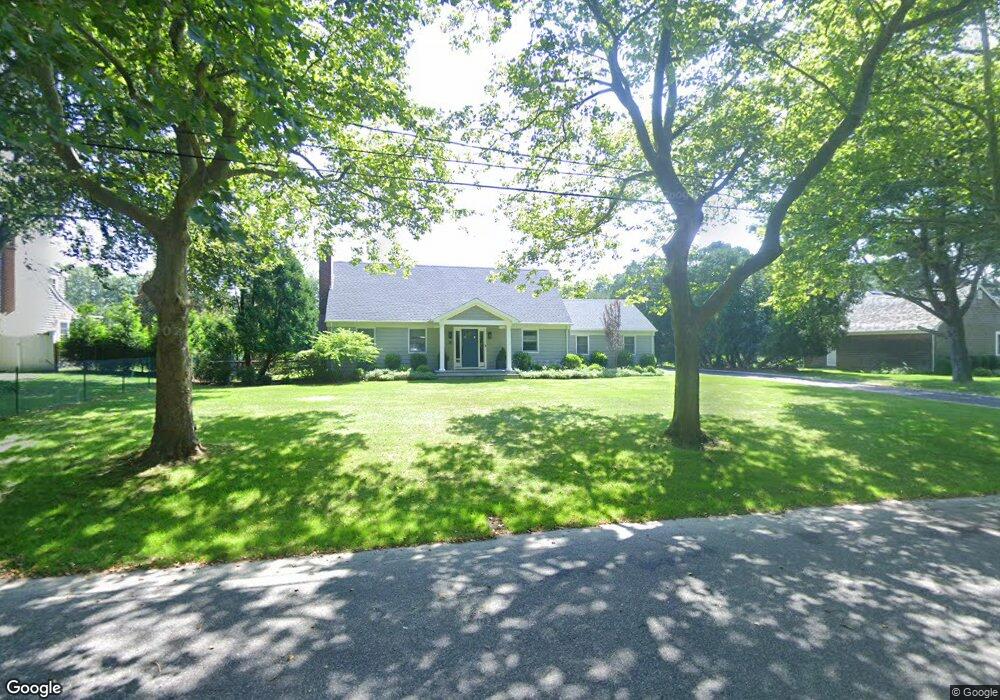
96 Anns Ln Southampton, NY 11968
Estimated Value: $3,222,000 - $5,434,000
3
Beds
2
Baths
1,911
Sq Ft
$2,080/Sq Ft
Est. Value
About This Home
This home is located at 96 Anns Ln, Southampton, NY 11968 and is currently estimated at $3,974,708, approximately $2,079 per square foot. 96 Anns Ln is a home located in Suffolk County with nearby schools including Southampton Elementary School, Southampton Intermediate School, and Southampton High School.
Ownership History
Date
Name
Owned For
Owner Type
Purchase Details
Closed on
Sep 11, 2019
Sold by
Kosciusko Michael J and Kosciusko Joan M
Bought by
Kosciusko John M and Kosciusko Claudia
Current Estimated Value
Purchase Details
Closed on
Nov 22, 2014
Sold by
Kosciusko John Michael
Bought by
Kosciusko John Michael
Purchase Details
Closed on
Jun 28, 2011
Sold by
Kosciusko Mary E
Bought by
Kosciusko Mary E and Michael R Kosciusko Family Trust I
Purchase Details
Closed on
Jan 7, 2011
Sold by
Kosciusko Michael R and Kosciusko Mary E
Bought by
Kosciusko Mary E
Purchase Details
Closed on
Mar 14, 1997
Sold by
Mojeski John M and Kosciusko Mary
Bought by
Kosciusko Mary
Create a Home Valuation Report for This Property
The Home Valuation Report is an in-depth analysis detailing your home's value as well as a comparison with similar homes in the area
Home Values in the Area
Average Home Value in this Area
Purchase History
| Date | Buyer | Sale Price | Title Company |
|---|---|---|---|
| Kosciusko John M | $875,000 | -- | |
| Kosciusko John Michael | -- | None Available | |
| Kosciusko Mary E | -- | -- | |
| Kosciusko Mary E | -- | -- | |
| Kosciusko Mary | $117,000 | Chicago Title Insurance Co |
Source: Public Records
Tax History Compared to Growth
Tax History
| Year | Tax Paid | Tax Assessment Tax Assessment Total Assessment is a certain percentage of the fair market value that is determined by local assessors to be the total taxable value of land and additions on the property. | Land | Improvement |
|---|---|---|---|---|
| 2024 | $2,127 | $2,034,400 | $1,675,500 | $358,900 |
| 2023 | $2,127 | $2,034,400 | $1,675,500 | $358,900 |
| 2022 | $5,471 | $2,034,400 | $1,675,500 | $358,900 |
| 2021 | $5,471 | $2,034,400 | $1,675,500 | $358,900 |
| 2020 | $7,587 | $2,034,400 | $1,675,500 | $358,900 |
| 2019 | $7,522 | $0 | $0 | $0 |
| 2018 | -- | $2,003,000 | $1,675,500 | $327,500 |
| 2017 | $6,050 | $2,003,000 | $1,675,500 | $327,500 |
| 2016 | $6,210 | $1,969,100 | $1,641,600 | $327,500 |
| 2015 | -- | $1,670,600 | $1,343,100 | $327,500 |
| 2014 | -- | $1,402,000 | $1,074,500 | $327,500 |
Source: Public Records
Map
Nearby Homes