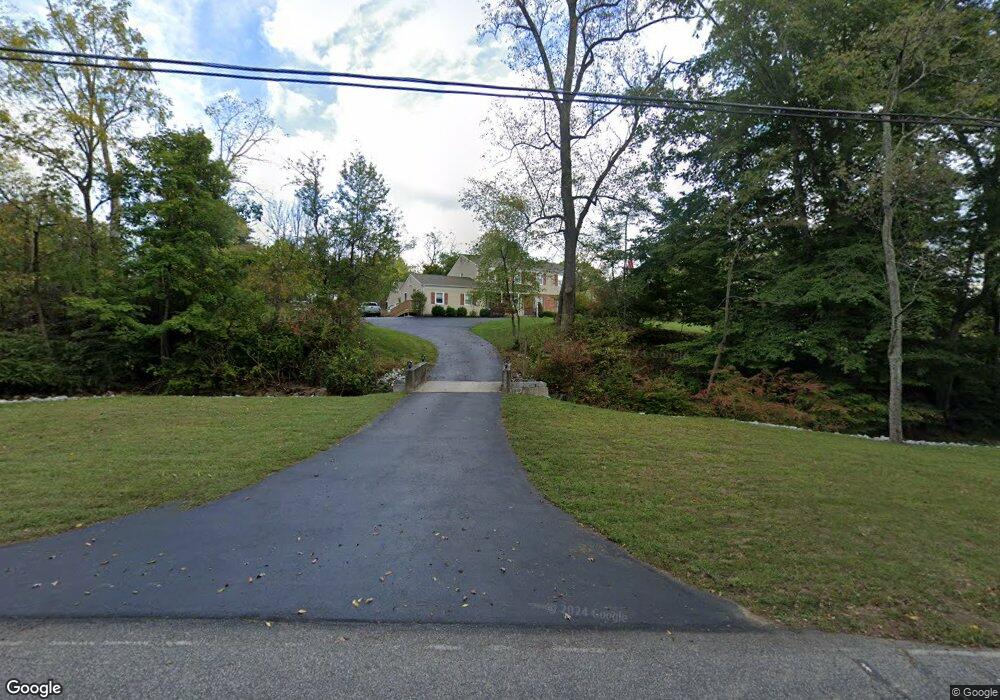
96 Barton Hollow Rd Flemington, NJ 08822
Estimated Value: $658,000 - $713,000
--
Bed
--
Bath
2,270
Sq Ft
$302/Sq Ft
Est. Value
About This Home
This home is located at 96 Barton Hollow Rd, Flemington, NJ 08822 and is currently estimated at $685,537, approximately $301 per square foot. 96 Barton Hollow Rd is a home located in Hunterdon County with nearby schools including Robert Hunter Elementary School, Reading Fleming Intermediate School, and J.P. Case Middle School.
Ownership History
Date
Name
Owned For
Owner Type
Purchase Details
Closed on
Mar 11, 2002
Sold by
Pontecorvo Gary J
Bought by
Weaver Kevin S and Weaver Ellen T
Current Estimated Value
Home Financials for this Owner
Home Financials are based on the most recent Mortgage that was taken out on this home.
Original Mortgage
$290,400
Outstanding Balance
$120,027
Interest Rate
6.91%
Estimated Equity
$565,510
Purchase Details
Closed on
Mar 22, 1997
Sold by
Harrell Albert D
Bought by
Pontecurvo Gary J and Pontecurvo Cynthia
Home Financials for this Owner
Home Financials are based on the most recent Mortgage that was taken out on this home.
Original Mortgage
$180,000
Interest Rate
7.55%
Purchase Details
Closed on
Oct 22, 1992
Sold by
Mazzetta Anthony and Mazzetta Mary
Bought by
Harrell Albert D and Harrell Linda A
Purchase Details
Closed on
Sep 18, 1990
Sold by
Suddendorf James E and Suddendorf Marian A
Bought by
Mazzetta Anthony and Mazzetta Mary
Create a Home Valuation Report for This Property
The Home Valuation Report is an in-depth analysis detailing your home's value as well as a comparison with similar homes in the area
Home Values in the Area
Average Home Value in this Area
Purchase History
| Date | Buyer | Sale Price | Title Company |
|---|---|---|---|
| Weaver Kevin S | $363,000 | -- | |
| Pontecurvo Gary J | $225,000 | -- | |
| Harrell Albert D | $220,000 | -- | |
| Mazzetta Anthony | $210,000 | -- |
Source: Public Records
Mortgage History
| Date | Status | Borrower | Loan Amount |
|---|---|---|---|
| Open | Weaver Kevin S | $290,400 | |
| Previous Owner | Pontecurvo Gary J | $180,000 |
Source: Public Records
Tax History Compared to Growth
Tax History
| Year | Tax Paid | Tax Assessment Tax Assessment Total Assessment is a certain percentage of the fair market value that is determined by local assessors to be the total taxable value of land and additions on the property. | Land | Improvement |
|---|---|---|---|---|
| 2025 | $13,425 | $463,400 | $207,300 | $256,100 |
| 2024 | $12,623 | $463,400 | $207,300 | $256,100 |
| 2023 | $12,623 | $463,400 | $207,300 | $256,100 |
| 2022 | $12,303 | $463,400 | $207,300 | $256,100 |
| 2021 | $10,582 | $420,100 | $207,300 | $212,800 |
| 2020 | $10,801 | $420,100 | $207,300 | $212,800 |
| 2019 | $10,582 | $420,100 | $207,300 | $212,800 |
| 2018 | $10,452 | $420,100 | $207,300 | $212,800 |
| 2017 | $10,292 | $420,100 | $207,300 | $212,800 |
| 2016 | $10,108 | $420,100 | $207,300 | $212,800 |
| 2015 | $9,762 | $416,300 | $207,300 | $209,000 |
| 2014 | $9,633 | $416,300 | $207,300 | $209,000 |
Source: Public Records
Map
Nearby Homes
- 5 Morningside Ct
- 1 Dale Dr
- 31 Cherryville Hollow Rd
- 158 Featherbed Ln
- 23 Valley View Dr
- 6 W View Dr
- 57 Featherbed Ln
- 125 Cherryville Hollow Rd
- 28 Old Clinton Rd
- 92 Oak Grove Rd
- 59 Cherryville Stanton Rd
- 14 William Barnes Rd
- 0 Hardscrabble Hill Rd
- 25 Haddenford Dr
- 150 Oak Grove Rd
- 12 Corcoran St
- 92 Park Ave
- 5 William Martin Way Unit 5
- 181 Old Croton Rd
- 5 Erin Place
- 98 Barton Hollow Rd
- 95 Barton Hollow Rd
- 102 Norton Way
- 104 Norton Way
- 100 Barton Hollow Rd
- 106 Norton Way
- 11 Wildwood Ct
- 100 Norton Way
- 102 Barton Hollow Rd
- 108 Norton Way
- 10 Wildwood Ct
- 12 Norton Dr
- 10 Norton Dr
- 104 Barton Hollow Rd
- 14 Norton Dr
- 8 Norton Dr
- 16 Norton Dr
- 7 Norton Dr
- 14 Partridge Run
- 9 Norton Dr