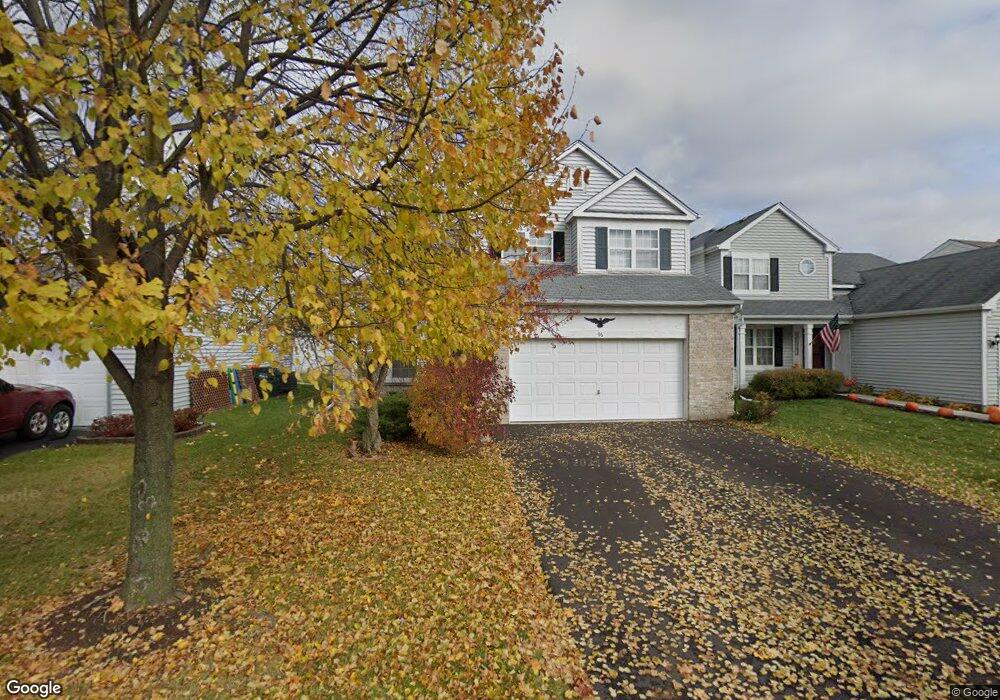
96 Centennial Dr Hainesville, IL 60073
Estimated Value: $290,000 - $360,000
3
Beds
3
Baths
1,682
Sq Ft
$193/Sq Ft
Est. Value
About This Home
This home is located at 96 Centennial Dr, Hainesville, IL 60073 and is currently estimated at $324,021, approximately $192 per square foot. 96 Centennial Dr is a home located in Lake County with nearby schools including W.J. Murphy Elementary School, John T. Magee Middle School, and Round Lake High School.
Ownership History
Date
Name
Owned For
Owner Type
Purchase Details
Closed on
Mar 1, 2010
Sold by
Deutsche Bank National Trust Company
Bought by
Anderson Eric and Anderson Sorenia
Current Estimated Value
Purchase Details
Closed on
Nov 3, 2009
Sold by
Chuop Sakhom and Case #08 Ch 4228
Bought by
Deutsche Bank National Trust Company
Purchase Details
Closed on
Sep 19, 2005
Sold by
Ortiz Axel A and Bonet Arleen
Bought by
Chuop Sakhom and Chuop Suong
Home Financials for this Owner
Home Financials are based on the most recent Mortgage that was taken out on this home.
Original Mortgage
$189,600
Interest Rate
7.15%
Mortgage Type
Purchase Money Mortgage
Purchase Details
Closed on
Apr 20, 2000
Sold by
The Hainesville Ltd Partnership Iii
Bought by
Ortiz Axel A and Bonet Arleen
Home Financials for this Owner
Home Financials are based on the most recent Mortgage that was taken out on this home.
Original Mortgage
$174,100
Interest Rate
8.24%
Create a Home Valuation Report for This Property
The Home Valuation Report is an in-depth analysis detailing your home's value as well as a comparison with similar homes in the area
Home Values in the Area
Average Home Value in this Area
Purchase History
| Date | Buyer | Sale Price | Title Company |
|---|---|---|---|
| Anderson Eric | $143,000 | Forum Title Insurance Co | |
| Deutsche Bank National Trust Company | -- | None Available | |
| Chuop Sakhom | $237,000 | -- | |
| Ortiz Axel A | $183,500 | First American Title |
Source: Public Records
Mortgage History
| Date | Status | Borrower | Loan Amount |
|---|---|---|---|
| Previous Owner | Chuop Sakhom | $189,600 | |
| Previous Owner | Ortiz Axel A | $174,100 |
Source: Public Records
Tax History
| Year | Tax Paid | Tax Assessment Tax Assessment Total Assessment is a certain percentage of the fair market value that is determined by local assessors to be the total taxable value of land and additions on the property. | Land | Improvement |
|---|---|---|---|---|
| 2024 | $6,822 | $85,243 | $12,509 | $72,734 |
| 2023 | $6,858 | $78,233 | $11,480 | $66,753 |
| 2022 | $6,858 | $75,225 | $9,252 | $65,973 |
| 2021 | $7,291 | $72,304 | $8,893 | $63,411 |
| 2020 | $7,557 | $73,920 | $8,461 | $65,459 |
| 2019 | $7,368 | $70,920 | $8,118 | $62,802 |
| 2018 | $7,422 | $63,245 | $11,491 | $51,754 |
| 2017 | $7,265 | $59,491 | $10,809 | $48,682 |
| 2016 | $6,988 | $54,917 | $9,978 | $44,939 |
| 2015 | $6,818 | $50,171 | $9,116 | $41,055 |
| 2014 | $4,625 | $37,071 | $8,242 | $28,829 |
| 2012 | $4,646 | $38,717 | $8,608 | $30,109 |
Source: Public Records
Map
Nearby Homes
- 318 Elder Dr
- 121 Highmoor Dr
- 116 Highmoor Dr
- 570 N Triumph Ct Unit 261
- 414 E Washington St
- 492 Patricia Ct
- 216 Brierhill Dr
- 34070 N Lilac Ave
- 328 Clifton Dr
- 510 Forest Glen Dr
- 529 N Ravine Dr
- 415 Kenwood Dr
- 26155 W Il Route 120
- 407 Greenwood Dr
- 29 N Macgillis Dr Unit 233
- 519 Greenwood Dr
- 249 W Whispering Oaks Ln Unit 295
- 241 W Whispering Oaks Ln Unit 29/1
- 482 N Colony Dr
- 508 Beechwood Dr
- 102 Centennial Dr
- 90 Centennial Dr
- 155 Clover Ct
- 108 Centennial Dr
- 161 Clover Ct
- 114 Centennial Dr
- 91 Centennial Dr
- 97 Centennial Dr
- 85 Centennial Dr
- 101 Centennial Dr
- 79 Centennial Dr
- 105 Centennial Dr
- 120 Centennial Dr
- 154 Clover Ct
- 160 Clover Ct
- 165 Clover Ct
- 110 Celebration Ct
- 126 Centennial Dr
- 167 Clover Ct
- 73 Centennial Dr
Your Personal Tour Guide
Ask me questions while you tour the home.