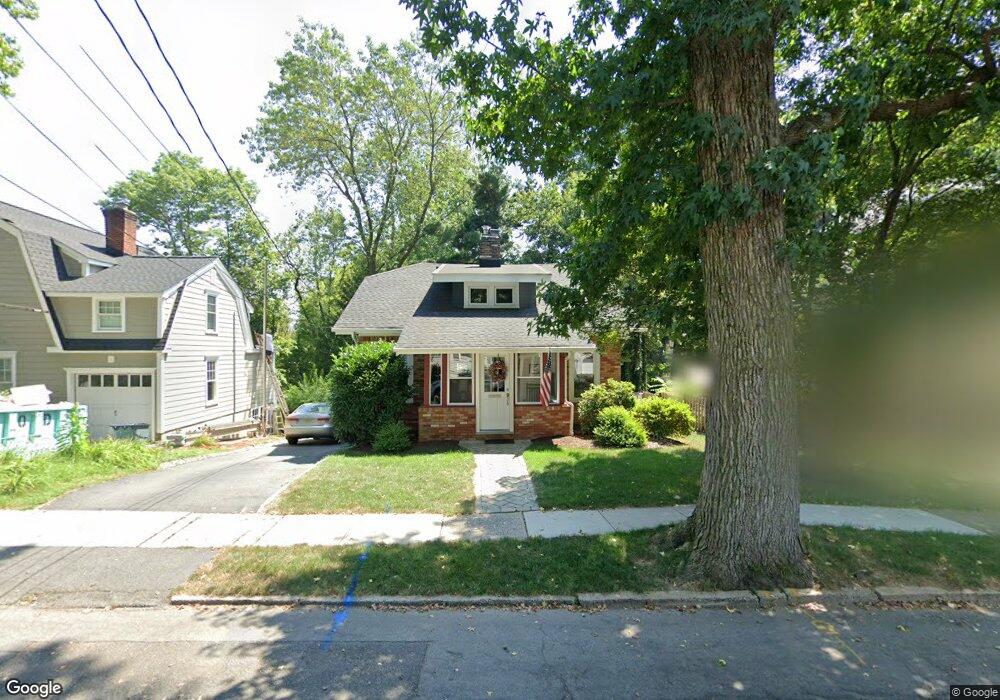
96 Center Ave Chatham, NJ 07928
Estimated Value: $951,000 - $1,119,760
--
Bed
--
Bath
1,529
Sq Ft
$682/Sq Ft
Est. Value
About This Home
This home is located at 96 Center Ave, Chatham, NJ 07928 and is currently estimated at $1,043,440, approximately $682 per square foot. 96 Center Ave is a home located in Morris County with nearby schools including Chatham High School, St. Patrick School, and ECLC of New Jersey.
Ownership History
Date
Name
Owned For
Owner Type
Purchase Details
Closed on
May 17, 2011
Sold by
Morsink Johannes and Snyder Nancy J
Bought by
Semioli Mark and Semioli Jennifer
Current Estimated Value
Home Financials for this Owner
Home Financials are based on the most recent Mortgage that was taken out on this home.
Original Mortgage
$275,000
Outstanding Balance
$191,112
Interest Rate
4.88%
Mortgage Type
New Conventional
Estimated Equity
$852,328
Purchase Details
Closed on
May 14, 2003
Sold by
Snyder Lloyd
Bought by
Morsink Johannes and Snyder Nancy
Home Financials for this Owner
Home Financials are based on the most recent Mortgage that was taken out on this home.
Original Mortgage
$252,000
Interest Rate
5.86%
Purchase Details
Closed on
Dec 19, 1998
Sold by
Dodd Sayer Zoe and Requa Sayer
Bought by
Snyder Lloyd I and Snyder Barbara Z
Home Financials for this Owner
Home Financials are based on the most recent Mortgage that was taken out on this home.
Original Mortgage
$170,000
Interest Rate
6.7%
Create a Home Valuation Report for This Property
The Home Valuation Report is an in-depth analysis detailing your home's value as well as a comparison with similar homes in the area
Home Values in the Area
Average Home Value in this Area
Purchase History
| Date | Buyer | Sale Price | Title Company |
|---|---|---|---|
| Semioli Mark | $485,000 | None Available | |
| Morsink Johannes | $315,000 | -- | |
| Snyder Lloyd I | $265,000 | -- |
Source: Public Records
Mortgage History
| Date | Status | Borrower | Loan Amount |
|---|---|---|---|
| Open | Semioli Mark | $275,000 | |
| Previous Owner | Morsink Johannes | $252,000 | |
| Previous Owner | Snyder Lloyd I | $170,000 |
Source: Public Records
Tax History Compared to Growth
Tax History
| Year | Tax Paid | Tax Assessment Tax Assessment Total Assessment is a certain percentage of the fair market value that is determined by local assessors to be the total taxable value of land and additions on the property. | Land | Improvement |
|---|---|---|---|---|
| 2025 | $12,419 | $767,100 | $476,500 | $290,600 |
| 2024 | $11,921 | $767,100 | $476,500 | $290,600 |
| 2023 | $11,921 | $767,100 | $476,500 | $290,600 |
| 2022 | $10,484 | $490,600 | $373,400 | $117,200 |
| 2021 | $10,484 | $490,600 | $373,400 | $117,200 |
| 2020 | $10,396 | $490,600 | $373,400 | $117,200 |
| 2019 | $10,322 | $490,600 | $373,400 | $117,200 |
| 2018 | $10,033 | $490,600 | $373,400 | $117,200 |
| 2017 | $9,743 | $490,600 | $373,400 | $117,200 |
| 2016 | $9,488 | $490,600 | $373,400 | $117,200 |
| 2015 | $9,375 | $490,600 | $373,400 | $117,200 |
| 2014 | $9,307 | $490,600 | $373,400 | $117,200 |
Source: Public Records
Map
Nearby Homes
- 22 Weston Ave
- 15 Duchamp Place
- 49 N Summit Ave Unit B
- 29 N Hillside Ave
- 151 Center Ave
- 111 N Summit Ave
- 24 N Summit Ave
- 1 John St
- 17 Coleman Ave W
- 30 Hillside Ave
- 149 N Hillside Ave
- 84 Fairmount Ave
- 57 Parrott Mill Rd
- 20 Orchard Rd
- 10 Garden Place
- 8 Mercer Ave
- 128 Fairmount Ave
- 5 Penn Terrace
- 169 Watchung Ave
- 2 Rose Ln