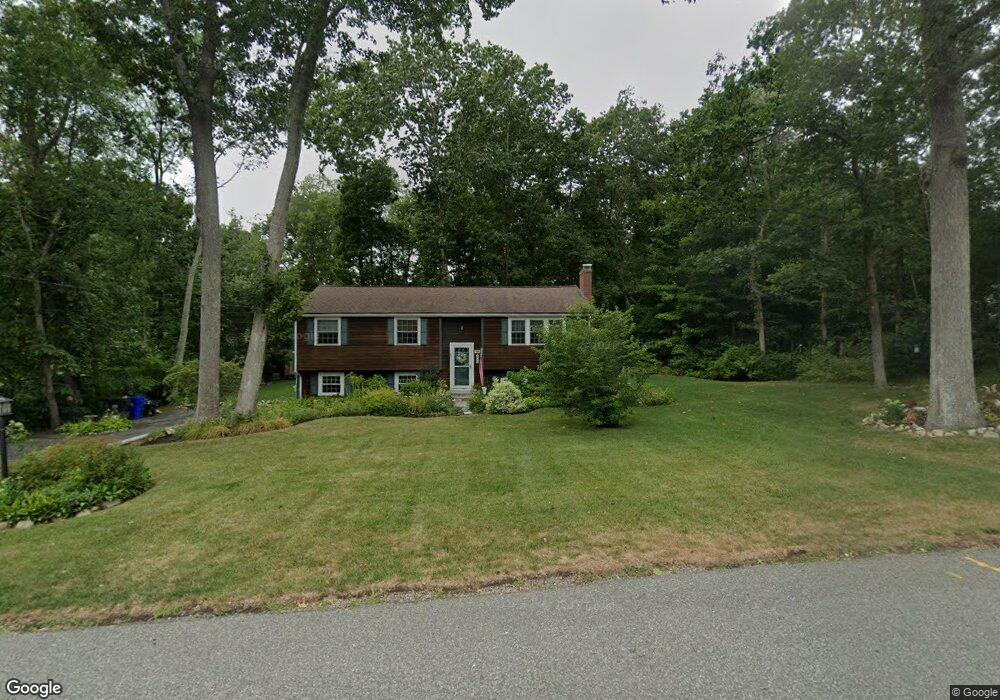
96 Chestnut St Hanover, MA 02339
Estimated Value: $726,135 - $840,000
3
Beds
2
Baths
1,382
Sq Ft
$583/Sq Ft
Est. Value
About This Home
This home is located at 96 Chestnut St, Hanover, MA 02339 and is currently estimated at $805,534, approximately $582 per square foot. 96 Chestnut St is a home located in Plymouth County with nearby schools including Hanover High School, South Shore Charter Public School, and Norwell KinderCare.
Ownership History
Date
Name
Owned For
Owner Type
Purchase Details
Closed on
Dec 6, 1993
Sold by
Stacy Sumner C and Stacy Judith M
Bought by
Sweeney Matthew and Sweeney Susan
Current Estimated Value
Home Financials for this Owner
Home Financials are based on the most recent Mortgage that was taken out on this home.
Original Mortgage
$142,650
Interest Rate
6.69%
Mortgage Type
Purchase Money Mortgage
Create a Home Valuation Report for This Property
The Home Valuation Report is an in-depth analysis detailing your home's value as well as a comparison with similar homes in the area
Home Values in the Area
Average Home Value in this Area
Purchase History
| Date | Buyer | Sale Price | Title Company |
|---|---|---|---|
| Sweeney Matthew | $158,500 | -- |
Source: Public Records
Mortgage History
| Date | Status | Borrower | Loan Amount |
|---|---|---|---|
| Open | Sweeney Matthew | $200,000 | |
| Closed | Sweeney Matthew | $50,000 | |
| Closed | Sweeney Matthew | $25,000 | |
| Closed | Sweeney Matthew | $142,650 |
Source: Public Records
Tax History
| Year | Tax Paid | Tax Assessment Tax Assessment Total Assessment is a certain percentage of the fair market value that is determined by local assessors to be the total taxable value of land and additions on the property. | Land | Improvement |
|---|---|---|---|---|
| 2025 | $8,067 | $653,200 | $269,600 | $383,600 |
| 2024 | $8,040 | $626,200 | $269,600 | $356,600 |
| 2023 | $7,955 | $589,700 | $245,100 | $344,600 |
| 2022 | $7,901 | $518,100 | $245,100 | $273,000 |
| 2021 | $6,352 | $466,000 | $222,800 | $243,200 |
| 2020 | $7,532 | $461,800 | $222,800 | $239,000 |
| 2019 | $7,025 | $428,100 | $222,800 | $205,300 |
| 2018 | $5,047 | $424,000 | $222,800 | $201,200 |
| 2017 | $6,461 | $391,100 | $210,000 | $181,100 |
| 2016 | $6,274 | $372,100 | $191,000 | $181,100 |
| 2015 | $5,455 | $337,800 | $191,000 | $146,800 |
Source: Public Records
Map
Nearby Homes
- 53 Chestnut St
- 776 Main St
- 506 Main St
- 535 Webster St
- 44 Stone Meadow Ln
- 62 Larchmont Ln
- 47 Stone Meadow Ln
- 46 Brookwood Rd
- 7 Assinippi Ave Unit 205
- 7 Assinippi Ave Unit 306
- 49 Washington Park Dr
- 164 Main St
- 68 East St
- 18 Winterberry Ln
- 36 Bayberry Ln
- 225 Prospect St
- 214 Washington St Unit 24
- 214 Washington St Unit 28
- 33 1st Parish Ln
- 738 Whiting St
- 86 Chestnut St
- 499 Old Town Way
- 453 Old Town Way
- 81 Chestnut St
- 515 Old Town Way
- 483 Old Town Way
- 439 Old Town Way
- 76 Chestnut St
- 65 Chestnut St
- 496 Old Town Way
- 508 Old Town Way
- 427 Old Town Way
- 527 Old Town Way
- 484 Old Town Way
- 442 Old Town Way
- 520 Old Town Way
- 466 Old Town Way
- 539 Old Town Way
- 476 Old Town Way
- 60 Chestnut St
Your Personal Tour Guide
Ask me questions while you tour the home.