96 Cyran St Chicopee, MA 01020
Fairview NeighborhoodEstimated Value: $323,457 - $352,000
3
Beds
2
Baths
1,248
Sq Ft
$275/Sq Ft
Est. Value
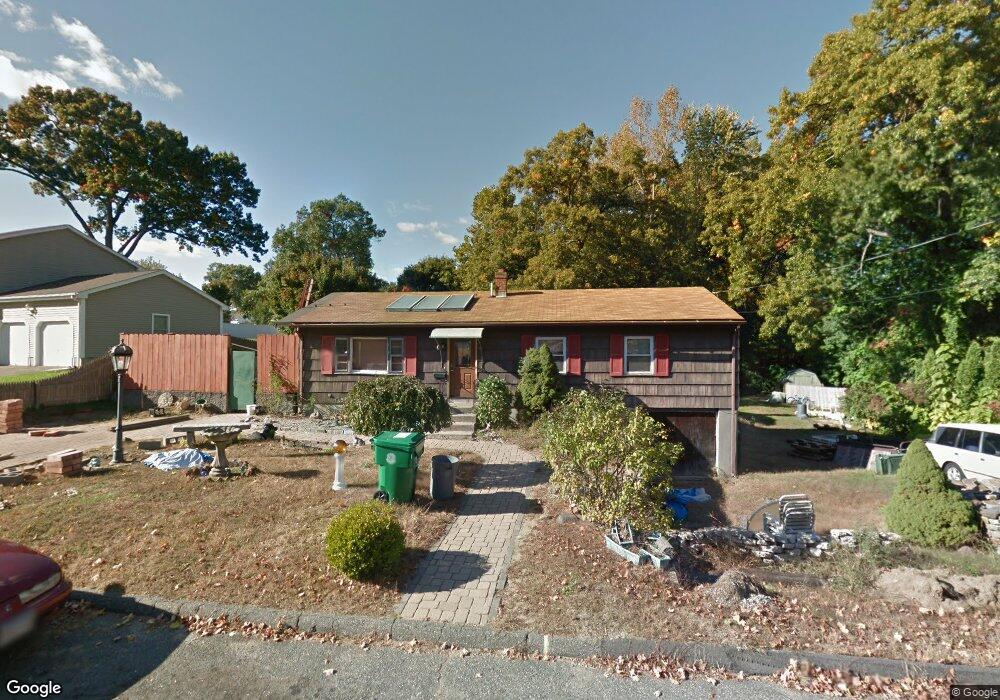
About This Home
This home is located at 96 Cyran St, Chicopee, MA 01020 and is currently estimated at $342,864, approximately $274 per square foot. 96 Cyran St is a home located in Hampden County with nearby schools including Streiber Elementary School, Fairview Middle School, and Chicopee Comprehensive High School.
Ownership History
Date
Name
Owned For
Owner Type
Purchase Details
Closed on
Aug 26, 2024
Sold by
Kerchner Paul F
Bought by
Kerchner Paul F and Donovan Susan
Current Estimated Value
Purchase Details
Closed on
Mar 17, 2015
Sold by
Kerchner Leonard A and Kerchner Catherine A
Bought by
Kerchner Paul F
Purchase Details
Closed on
Jul 3, 1967
Bought by
Kerchner Leonard A and Kerchner Catherine
Create a Home Valuation Report for This Property
The Home Valuation Report is an in-depth analysis detailing your home's value as well as a comparison with similar homes in the area
Home Values in the Area
Average Home Value in this Area
Purchase History
| Date | Buyer | Sale Price | Title Company |
|---|---|---|---|
| Kerchner Paul F | -- | None Available | |
| Kerchner Paul F | -- | None Available | |
| Kerchner Paul F | -- | -- | |
| Kerchner Leonard A | -- | -- | |
| Kerchner Paul F | -- | -- |
Source: Public Records
Tax History
| Year | Tax Paid | Tax Assessment Tax Assessment Total Assessment is a certain percentage of the fair market value that is determined by local assessors to be the total taxable value of land and additions on the property. | Land | Improvement |
|---|---|---|---|---|
| 2025 | $3,896 | $257,000 | $113,100 | $143,900 |
| 2024 | $3,694 | $250,300 | $110,800 | $139,500 |
| 2023 | $3,427 | $226,200 | $100,800 | $125,400 |
| 2022 | $3,267 | $192,300 | $87,600 | $104,700 |
| 2021 | $3,152 | $179,000 | $79,600 | $99,400 |
| 2020 | $3,045 | $174,400 | $81,800 | $92,600 |
| 2019 | $3,010 | $167,600 | $81,800 | $85,800 |
| 2018 | $2,937 | $160,400 | $77,900 | $82,500 |
| 2017 | $2,782 | $160,700 | $71,400 | $89,300 |
| 2016 | $2,814 | $166,400 | $71,400 | $95,000 |
| 2015 | $2,724 | $155,300 | $71,400 | $83,900 |
| 2014 | $2,564 | $155,300 | $71,400 | $83,900 |
Source: Public Records
Map
Nearby Homes
- 83 Old Farm Rd
- 460 Irene St
- 67 Streiber Dr
- 119 Oakridge St
- 84 Montcalm St
- 0 Irene St
- 523 James St
- 70 Warwick Rd
- 56 Longwood Dr
- 1709 Memorial Dr
- 81 Mccarthy Ave
- 58 Robinridge Rd
- 144 Horseshoe Dr
- 70 Greenwood Terrace
- 156 Horseshoe Dr
- 47 Boucher Cir
- 15 Hudson Ave
- 15 Cross St
- 37 Greenwood Terrace
- 39 Dixie Terrace
Your Personal Tour Guide
Ask me questions while you tour the home.