Estimated Value: $392,285
Studio
--
Bath
24,500
Sq Ft
$16/Sq Ft
Est. Value
About This Home
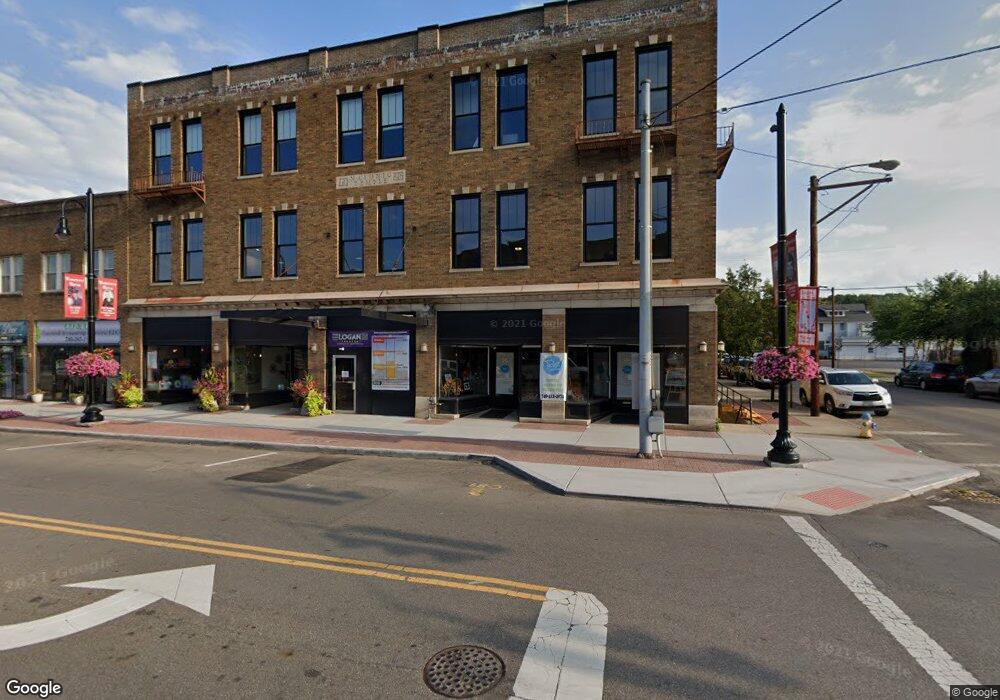
This home is located at 96 E Main St, Logan, OH 43138 and is currently estimated at $392,285, approximately $16 per square foot. 96 E Main St is a home located in Hocking County with nearby schools including Central Elementary School, St. John the Evangelist School, and Logan Christian School.
Ownership History
Date
Name
Owned For
Owner Type
Purchase Details
Closed on
Apr 26, 2019
Sold by
Logan Town Center Inc
Bought by
Logan Theater Inc
Current Estimated Value
Home Financials for this Owner
Home Financials are based on the most recent Mortgage that was taken out on this home.
Original Mortgage
$180,000
Outstanding Balance
$150,621
Interest Rate
4.3%
Mortgage Type
Future Advance Clause Open End Mortgage
Estimated Equity
$241,664
Purchase Details
Closed on
Apr 6, 2019
Home Financials for this Owner
Home Financials are based on the most recent Mortgage that was taken out on this home.
Original Mortgage
$180,000
Outstanding Balance
$150,621
Interest Rate
4.3%
Mortgage Type
Future Advance Clause Open End Mortgage
Estimated Equity
$241,664
Purchase Details
Closed on
Aug 1, 2018
Sold by
Swain David
Bought by
Logan Town Center Inc
Home Financials for this Owner
Home Financials are based on the most recent Mortgage that was taken out on this home.
Original Mortgage
$180,000
Interest Rate
4.5%
Mortgage Type
Future Advance Clause Open End Mortgage
Create a Home Valuation Report for This Property
The Home Valuation Report is an in-depth analysis detailing your home's value as well as a comparison with similar homes in the area
Home Values in the Area
Average Home Value in this Area
Purchase History
| Date | Buyer | Sale Price | Title Company |
|---|---|---|---|
| Logan Theater Inc | $229,300 | None Available | |
| -- | $229,278 | -- | |
| Logan Town Center Inc | $225,000 | None Available |
Source: Public Records
Mortgage History
| Date | Status | Borrower | Loan Amount |
|---|---|---|---|
| Open | Logan Theater Inc | $180,000 | |
| Closed | -- | -- | |
| Previous Owner | Logan Town Center Inc | $180,000 |
Source: Public Records
Tax History
| Year | Tax Paid | Tax Assessment Tax Assessment Total Assessment is a certain percentage of the fair market value that is determined by local assessors to be the total taxable value of land and additions on the property. | Land | Improvement |
|---|---|---|---|---|
| 2024 | $3,302 | $71,060 | $34,010 | $37,050 |
| 2023 | $3,388 | $71,060 | $34,010 | $37,050 |
| 2022 | $3,342 | $71,060 | $34,010 | $37,050 |
| 2021 | $2,287 | $45,110 | $19,840 | $25,270 |
| 2020 | $2,282 | $45,110 | $19,840 | $25,270 |
| 2019 | $2,308 | $45,110 | $19,840 | $25,270 |
| 2018 | $2,060 | $41,240 | $19,840 | $21,400 |
| 2017 | $1,961 | $41,240 | $19,840 | $21,400 |
| 2016 | $1,882 | $41,240 | $19,840 | $21,400 |
| 2015 | $2,422 | $52,050 | $20,430 | $31,620 |
| 2014 | $2,422 | $52,050 | $20,430 | $31,620 |
| 2013 | $2,436 | $52,050 | $20,430 | $31,620 |
Source: Public Records
Map
Nearby Homes
- 12221 Ohio 93
- 17206 Ohio 93
- 0 Ohio 93 Unit 2418561
- 0 Ohio 93 Unit 9904905
- 0 Ohio 93 Unit 221025526
- 0 Ohio 93 Unit 221020942
- 0 Ohio 93 Unit Lot 84 2803089
- 0 Ohio 93 Unit 217016740
- 0 Ohio 93 Unit 221005551
- 0 Ohio 93 Unit 219037941
- 0 Ohio 93 Unit 219025903
- 0 Ohio 93 Unit Lot 6 213026790
- 0 Ohio 93 Unit Lot 7 213026792
- 0 Ohio 93
- 0 Sr 93 Unit 9916411
- 0 N State Route 93 Unit 9920501
- 0 N State Route 93 Unit 2612216
- 0 N State Route 93 Unit 224005992
- 0 Sr 93 Unit 9918045
- 0 N State Route 93 Unit 223007331
Your Personal Tour Guide
Ask me questions while you tour the home.