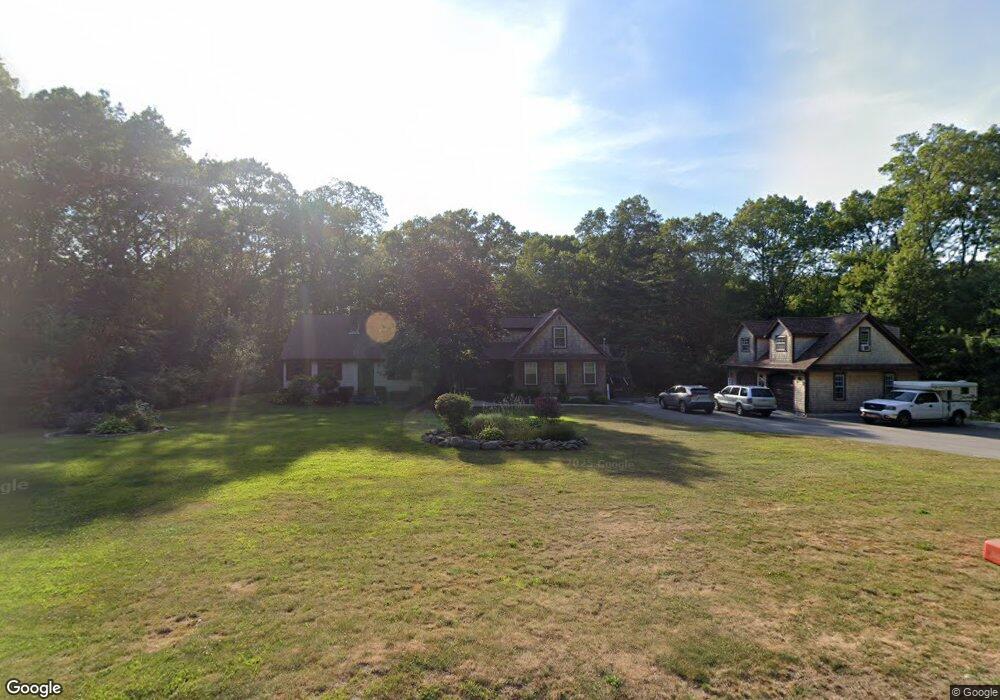
96 Fairview Ave Rehoboth, MA 02769
Estimated Value: $757,590 - $1,115,000
4
Beds
4
Baths
2,409
Sq Ft
$369/Sq Ft
Est. Value
About This Home
This home is located at 96 Fairview Ave, Rehoboth, MA 02769 and is currently estimated at $888,398, approximately $368 per square foot. 96 Fairview Ave is a home located in Bristol County with nearby schools including Dighton-Rehoboth Regional High School, Grace Baptist Christian Academy, and The Pinecroft School.
Ownership History
Date
Name
Owned For
Owner Type
Purchase Details
Closed on
Oct 15, 2021
Sold by
Greaves Jean A and Jordon Wendy
Bought by
Jordon Wendy
Current Estimated Value
Purchase Details
Closed on
May 14, 2021
Sold by
Jordon Wendy A
Bought by
Greaves Jean A and Jordon Wendy A
Home Financials for this Owner
Home Financials are based on the most recent Mortgage that was taken out on this home.
Original Mortgage
$352,800
Interest Rate
2.9%
Mortgage Type
New Conventional
Purchase Details
Closed on
Sep 4, 2019
Sold by
Jordan Jon E and Jordan Wendy A
Bought by
Jordan Wendy A
Purchase Details
Closed on
Jun 3, 2014
Sold by
Greaves 3Rd Charles A and Greaves Jean A
Bought by
Greaves Kevin C and Szczoczarz Wendy A
Purchase Details
Closed on
Jun 1, 1977
Bought by
Greaves Kevin C
Create a Home Valuation Report for This Property
The Home Valuation Report is an in-depth analysis detailing your home's value as well as a comparison with similar homes in the area
Home Values in the Area
Average Home Value in this Area
Purchase History
| Date | Buyer | Sale Price | Title Company |
|---|---|---|---|
| Jordon Wendy | -- | None Available | |
| Jordon Wendy | -- | None Available | |
| Greaves Jean A | -- | None Available | |
| Greaves Jean A | -- | None Available | |
| Jordan Wendy A | -- | -- | |
| Greaves Kevin C | -- | -- | |
| Greaves Kevin C | -- | -- | |
| Greaves Kevin C | -- | -- |
Source: Public Records
Mortgage History
| Date | Status | Borrower | Loan Amount |
|---|---|---|---|
| Previous Owner | Greaves Jean A | $352,800 | |
| Previous Owner | Greaves Kevin C | $15,000 |
Source: Public Records
Tax History
| Year | Tax Paid | Tax Assessment Tax Assessment Total Assessment is a certain percentage of the fair market value that is determined by local assessors to be the total taxable value of land and additions on the property. | Land | Improvement |
|---|---|---|---|---|
| 2025 | $77 | $693,000 | $195,600 | $497,400 |
| 2024 | $5,955 | $524,200 | $195,600 | $328,600 |
| 2023 | $5,601 | $515,500 | $191,600 | $323,900 |
| 2022 | $5,601 | $442,100 | $183,200 | $258,900 |
| 2021 | $5,174 | $390,800 | $166,900 | $223,900 |
| 2020 | $5,011 | $381,900 | $166,900 | $215,000 |
| 2018 | $3,470 | $289,900 | $159,100 | $130,800 |
| 2017 | $3,418 | $272,100 | $159,100 | $113,000 |
| 2016 | $3,242 | $266,800 | $159,100 | $107,700 |
| 2015 | $3,471 | $282,000 | $151,900 | $130,100 |
| 2014 | $3,304 | $265,600 | $144,700 | $120,900 |
Source: Public Records
Map
Nearby Homes
- 154 Fairview Ave
- 20 Mine Brook Rd
- 71 Agricultural Ave
- 438 Tremont St
- 245 Perryville Rd
- 43 Smith St
- Lot 11 Ledge Hill Ln
- 22 Bucklin Dr
- 7 Ledge Hill Ln
- 156 Rocky Hill Rd
- 43 Starr Ln
- 257 Anawan St
- 1 Clubhouse Way
- 240 Smith St
- 3 Wilmarth St
- 1336 Park St
- 51 Saveena Dr
- 10 Muriel Way
- 58 Saveena Dr
- 19 York Dr
- 100 Fairview Ave
- 92 Fairview Ave
- 97 Fairview Ave
- 104 Fairview Ave
- 103 Fairview Ave
- 90 Fairview Ave
- 108 Fairview Ave
- 84 Fairview Ave
- 89 Fairview Ave
- 113 Fairview Ave
- 85 Fairview Ave
- 115 Fairview Ave
- 2 Ash St
- 80 Fairview Ave
- 109 Fairview Ave
- 93 Fairview Ave
- 6 Ash St
- 81 Fairview Ave
- 114 Fairview Ave
- 76 Fairview Ave
Your Personal Tour Guide
Ask me questions while you tour the home.