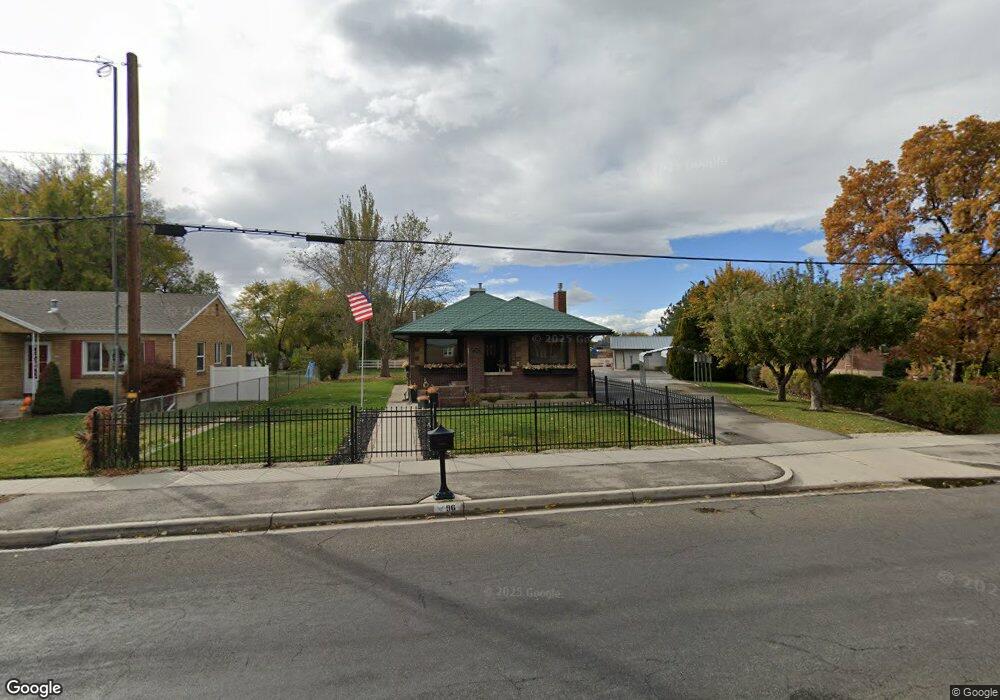
96 Flint St Layton, UT 84041
Estimated Value: $425,000 - $509,000
3
Beds
1
Bath
1,010
Sq Ft
$451/Sq Ft
Est. Value
About This Home
This home is located at 96 Flint St, Layton, UT 84041 and is currently estimated at $455,373, approximately $450 per square foot. 96 Flint St is a home located in Davis County with nearby schools including Layton Elementary School, Fairfield Junior High School, and Layton High School.
Ownership History
Date
Name
Owned For
Owner Type
Purchase Details
Closed on
Oct 23, 2019
Sold by
Zaugg Patricia and Zaugg Rodney
Bought by
Bizios Lacy C and Takahashi Richard J
Current Estimated Value
Home Financials for this Owner
Home Financials are based on the most recent Mortgage that was taken out on this home.
Original Mortgage
$189,600
Outstanding Balance
$166,099
Interest Rate
3.5%
Mortgage Type
New Conventional
Estimated Equity
$289,274
Purchase Details
Closed on
May 29, 2008
Sold by
Earl Rodney E and Earl Bernice S
Bought by
Earl Rodney E and Earl Bernice S
Create a Home Valuation Report for This Property
The Home Valuation Report is an in-depth analysis detailing your home's value as well as a comparison with similar homes in the area
Home Values in the Area
Average Home Value in this Area
Purchase History
| Date | Buyer | Sale Price | Title Company |
|---|---|---|---|
| Bizios Lacy C | -- | Stewart Title Ins Agency | |
| Earl Rodney E | -- | None Available |
Source: Public Records
Mortgage History
| Date | Status | Borrower | Loan Amount |
|---|---|---|---|
| Open | Bizios Lacy C | $189,600 |
Source: Public Records
Tax History
| Year | Tax Paid | Tax Assessment Tax Assessment Total Assessment is a certain percentage of the fair market value that is determined by local assessors to be the total taxable value of land and additions on the property. | Land | Improvement |
|---|---|---|---|---|
| 2025 | $2,279 | $239,251 | $167,753 | $71,498 |
| 2024 | $2,190 | $231,549 | $171,703 | $59,846 |
| 2023 | $2,098 | $391,000 | $198,792 | $192,208 |
| 2022 | $2,266 | $229,350 | $104,949 | $124,401 |
| 2021 | $2,146 | $324,000 | $157,319 | $166,681 |
| 2020 | $1,933 | $279,899 | $137,315 | $142,584 |
| 2019 | $1,805 | $256,000 | $128,711 | $127,289 |
| 2018 | $1,596 | $227,249 | $114,192 | $113,057 |
| 2016 | $1,460 | $107,224 | $51,258 | $55,966 |
| 2015 | $1,456 | $101,540 | $51,258 | $50,282 |
| 2014 | $1,304 | $92,955 | $51,258 | $41,697 |
| 2013 | -- | $82,355 | $42,029 | $40,326 |
Source: Public Records
Map
Nearby Homes
Your Personal Tour Guide
Ask me questions while you tour the home.