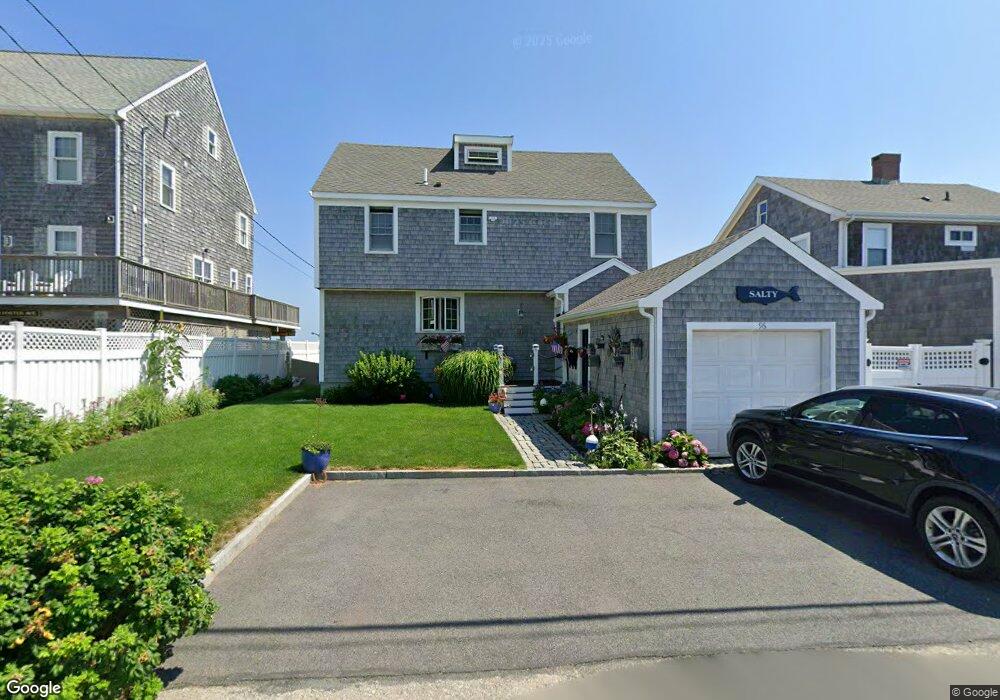
96 Foster Ave Marshfield, MA 02050
Ocean Bluff-Brant Rock NeighborhoodEstimated Value: $1,065,000 - $1,189,000
4
Beds
2
Baths
1,636
Sq Ft
$694/Sq Ft
Est. Value
About This Home
This home is located at 96 Foster Ave, Marshfield, MA 02050 and is currently estimated at $1,135,149, approximately $693 per square foot. 96 Foster Ave is a home located in Plymouth County with nearby schools including Daniel Webster, Furnace Brook Middle School, and Marshfield High School.
Ownership History
Date
Name
Owned For
Owner Type
Purchase Details
Closed on
May 27, 2005
Sold by
Mahoney Nancy M and Mahoney Michael T
Bought by
Mahoney Nancy M
Current Estimated Value
Home Financials for this Owner
Home Financials are based on the most recent Mortgage that was taken out on this home.
Original Mortgage
$255,000
Interest Rate
5.94%
Mortgage Type
Purchase Money Mortgage
Purchase Details
Closed on
May 28, 2003
Sold by
Mahoney John J
Bought by
Mahoney Nancy M
Create a Home Valuation Report for This Property
The Home Valuation Report is an in-depth analysis detailing your home's value as well as a comparison with similar homes in the area
Home Values in the Area
Average Home Value in this Area
Purchase History
| Date | Buyer | Sale Price | Title Company |
|---|---|---|---|
| Mahoney Nancy M | -- | -- | |
| Mahoney Nancy M | -- | -- | |
| Mahoney Nancy M | $127,395 | -- | |
| Mahoney Nancy M | $127,395 | -- |
Source: Public Records
Mortgage History
| Date | Status | Borrower | Loan Amount |
|---|---|---|---|
| Open | Mahoney Nancy M | $296,000 | |
| Closed | Mahoney Nancy M | $255,000 |
Source: Public Records
Tax History
| Year | Tax Paid | Tax Assessment Tax Assessment Total Assessment is a certain percentage of the fair market value that is determined by local assessors to be the total taxable value of land and additions on the property. | Land | Improvement |
|---|---|---|---|---|
| 2025 | $11,163 | $1,127,600 | $831,600 | $296,000 |
| 2024 | $10,626 | $1,022,700 | $752,400 | $270,300 |
| 2023 | $9,663 | $948,600 | $712,800 | $235,800 |
| 2022 | $9,663 | $746,200 | $544,500 | $201,700 |
| 2021 | $8,546 | $647,900 | $465,300 | $182,600 |
| 2020 | $8,178 | $613,500 | $435,600 | $177,900 |
| 2019 | $8,080 | $603,900 | $435,600 | $168,300 |
| 2018 | $8,031 | $600,700 | $435,600 | $165,100 |
| 2017 | $8,061 | $587,500 | $435,600 | $151,900 |
| 2016 | $8,023 | $578,000 | $435,600 | $142,400 |
| 2015 | $8,666 | $652,100 | $514,800 | $137,300 |
| 2014 | $8,056 | $606,200 | $475,200 | $131,000 |
Source: Public Records
Map
Nearby Homes
- 100 Foster Ave
- 92 Foster Ave
- Lot 1 Strawberry Farm Rd
- lot 1 Birch Rd
- 0 1st Rd
- 88 Foster Ave
- 91 Foster Ave
- 104 Foster Ave
- 87 Foster Ave
- 97 Foster Ave
- 103 Foster Ave(winter)
- 103 Foster Ave
- 103 Foster Ave Unit 103
- 103 Foster Ave Unit No
- 0 2nd Rd
- 86 Foster Ave
- 108 Foster Ave
- 105 Foster Ave
- 20 1st Rd
- 14 Brook St
Your Personal Tour Guide
Ask me questions while you tour the home.