S
Seller's Agent in 2015
Shawn Shelley
Jefferson Real Estate, Inc.

Estimated Value: $230,000 - $307,000
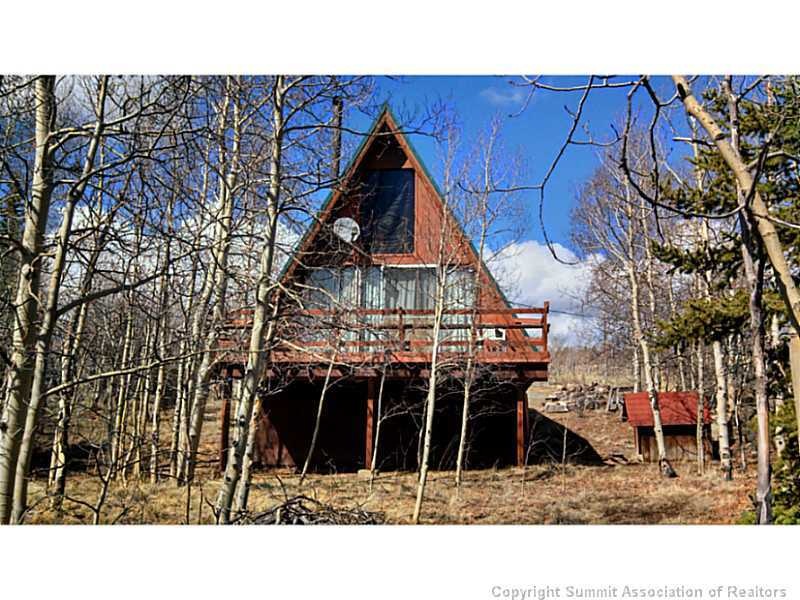
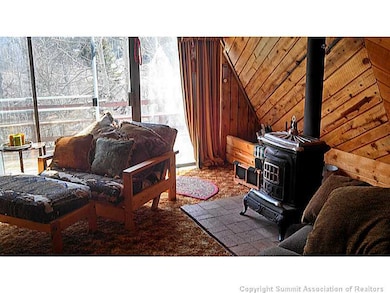
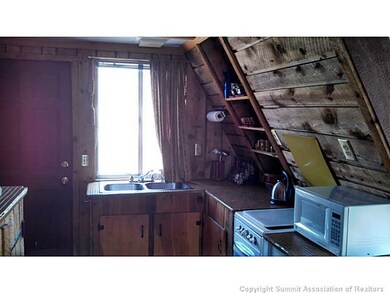
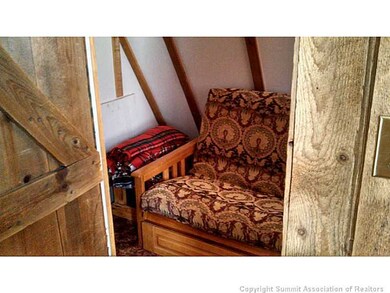
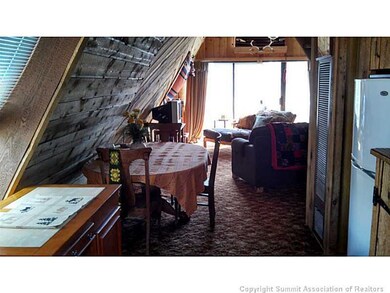
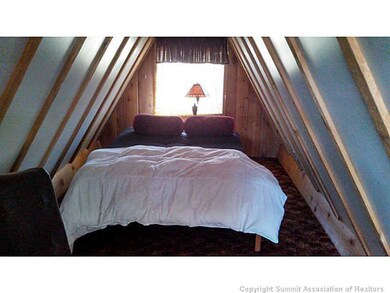
Cute and Cozy cabin! Situated on a gorgeous lot with rocks, trees and big views. Beautiful Antique Wood stove to keep you warm in the winter and on cool nights. One bedroom in loft and another on main level. Comes complete with well and septic. Membership in an exclusive fishing club with stocked fishing reservoirs and private stream fishing comes with the property.
Last Agent to Sell the Property
Shawn Shelley
Jefferson Real Estate, Inc. License #FA100049267 Listed on: 05/21/2014
Last Buyer's Agent
Shawn Shelley
Jefferson Real Estate, Inc. License #FA100049267 Listed on: 05/21/2014
We collect this data history from publicly available records. To have your information removed, we recommend requesting removal directly through your county’s website.
We collect this data history from publicly available records. To have your information removed, we recommend requesting removal directly through your county’s website.
| Date | Buyer | Sale Price | Title Company |
|---|---|---|---|
| $109,500 | Fidelity National Title Insu | ||
| -- | None Available |
We collect this data history from publicly available records. To have your information removed, we recommend requesting removal directly through your county’s website.
| Date | Event | Price | List to Sale | Price per Sq Ft |
|---|---|---|---|---|
| 04/29/2015 04/29/15 | Sold | $109,500 | 0.0% | $109 / Sq Ft |
| 03/30/2015 03/30/15 | Pending | -- | -- | -- |
| 05/21/2014 05/21/14 | For Sale | $109,500 | -- | $109 / Sq Ft |
We collect this data history from publicly available records. To have your information removed, we recommend requesting removal directly through your county’s website.
| Year | Tax Paid | Tax Assessment Tax Assessment Total Assessment is a certain percentage of the fair market value that is determined by local assessors to be the total taxable value of land and additions on the property. | Land | Improvement |
|---|---|---|---|---|
| 2025 | $829 | $13,420 | $5,640 | $7,780 |
| 2024 | $796 | $13,980 | $4,540 | $9,440 |
| 2023 | $796 | $13,980 | $4,540 | $9,440 |
| 2022 | $659 | $10,135 | $3,719 | $6,416 |
| 2021 | $667 | $10,430 | $3,830 | $6,600 |
| 2020 | $492 | $7,490 | $2,240 | $5,250 |
| 2019 | $478 | $7,490 | $2,240 | $5,250 |
| 2018 | $420 | $7,490 | $2,240 | $5,250 |
| 2017 | $361 | $6,450 | $2,170 | $4,280 |
| 2016 | $463 | $8,150 | $2,140 | $6,010 |
| 2015 | $472 | $8,150 | $2,140 | $6,010 |
| 2014 | -- | $0 | $0 | $0 |
S
Seller's Agent in 2015
Shawn Shelley
Jefferson Real Estate, Inc.
Source: Summit MLS
MLS Number: S387795
APN: 30837
Disclaimer: Certain information contained herein is derived from information provided by parties other than Homes.com. All information provided is deemed reliable, but is not guaranteed to be accurate and should be independently verified.
![]() Copyright © 2026 SAR MLS. The information displayed herein was derived from sources believed to be accurate, but has not been verified by SAR MLS. Buyers are cautioned to verify all information to their own satisfaction. This information is exclusively for viewers’ personal, non-commercial use. Any republication or reproduction of the information herein without the express permission of the SAR MLS is strictly prohibited.
Copyright © 2026 SAR MLS. The information displayed herein was derived from sources believed to be accurate, but has not been verified by SAR MLS. Buyers are cautioned to verify all information to their own satisfaction. This information is exclusively for viewers’ personal, non-commercial use. Any republication or reproduction of the information herein without the express permission of the SAR MLS is strictly prohibited.
Ask me questions while you tour the home.