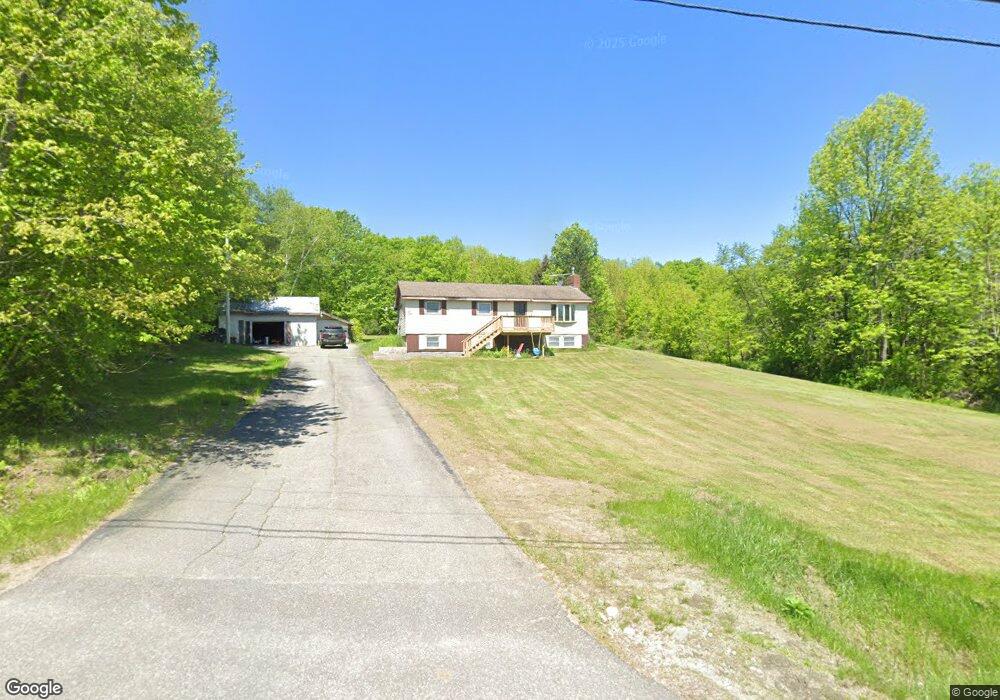
96 Hinkley Rd West Gardiner, ME 04345
Estimated Value: $276,349 - $360,000
--
Bed
--
Bath
--
Sq Ft
--
Built
About This Home
This home is located at 96 Hinkley Rd, West Gardiner, ME 04345 and is currently estimated at $314,837. 96 Hinkley Rd is a home with nearby schools including Gardiner Area High School.
Ownership History
Date
Name
Owned For
Owner Type
Purchase Details
Closed on
Nov 30, 2018
Sold by
Brown Darryl G
Bought by
Brown Hunter D
Current Estimated Value
Home Financials for this Owner
Home Financials are based on the most recent Mortgage that was taken out on this home.
Original Mortgage
$42,000
Outstanding Balance
$36,858
Interest Rate
4.8%
Mortgage Type
New Conventional
Estimated Equity
$277,979
Purchase Details
Closed on
Jul 31, 2018
Sold by
Oben Joan M
Bought by
Brown Darryl G
Create a Home Valuation Report for This Property
The Home Valuation Report is an in-depth analysis detailing your home's value as well as a comparison with similar homes in the area
Home Values in the Area
Average Home Value in this Area
Purchase History
| Date | Buyer | Sale Price | Title Company |
|---|---|---|---|
| Brown Hunter D | -- | -- | |
| Brown Hunter D | -- | -- | |
| Brown Hunter D | -- | -- | |
| Brown Hunter D | -- | -- | |
| Brown Darryl G | -- | -- | |
| Brown Darryl G | -- | -- | |
| Brown Darryl G | -- | -- |
Source: Public Records
Mortgage History
| Date | Status | Borrower | Loan Amount |
|---|---|---|---|
| Open | Brown Hunter D | $42,000 | |
| Closed | Brown Hunter D | $42,000 |
Source: Public Records
Tax History Compared to Growth
Tax History
| Year | Tax Paid | Tax Assessment Tax Assessment Total Assessment is a certain percentage of the fair market value that is determined by local assessors to be the total taxable value of land and additions on the property. | Land | Improvement |
|---|---|---|---|---|
| 2024 | $2,047 | $257,500 | $53,500 | $204,000 |
| 2023 | $1,827 | $225,600 | $45,600 | $180,000 |
| 2022 | $1,690 | $203,600 | $45,600 | $158,000 |
| 2021 | $1,611 | $169,600 | $45,600 | $124,000 |
| 2020 | $1,698 | $151,600 | $45,600 | $106,000 |
| 2019 | $1,697 | $147,600 | $45,600 | $102,000 |
| 2018 | $1,756 | $147,600 | $45,600 | $102,000 |
| 2017 | $1,815 | $147,600 | $45,600 | $102,000 |
| 2016 | $1,771 | $147,600 | $45,600 | $102,000 |
| 2013 | $1,609 | $147,600 | $45,600 | $102,000 |
Source: Public Records
Map
Nearby Homes
- 47 Adams Ln
- 178 Rockwood Estates
- 2 Oakwood Rd
- 20 Blackberry Hill Rd
- Lot 2 Rockwood Estates
- 67 Rockwood Estates
- TBD 1st St
- 998 Lewiston Rd
- 2 Woods Rd
- 102 Manning Dr
- 301 Pond Rd
- TBD Pond Rd
- Lot 4 Cobbo Ln
- 39 Lobo Ln
- Lot 5 Cobbo Ln
- 14 Blt Dr
- Lot 6 Cobbo Ln
- Lot 7 Cobbo Ln
- Map7Lot2A Caldwell Rd
- Map7Lot2B Caldwell Rd