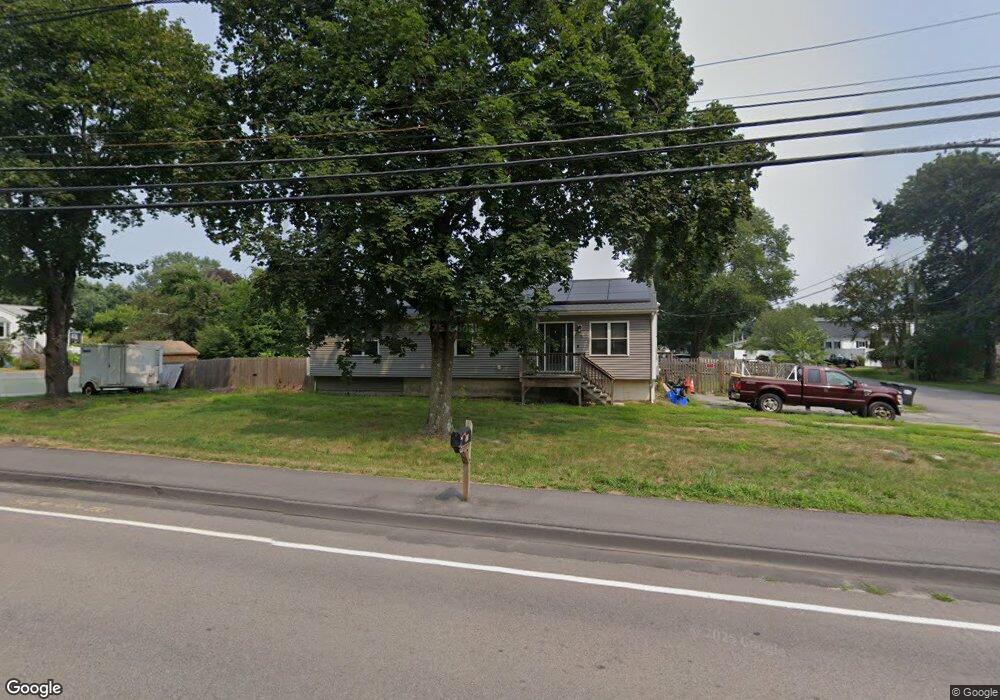
96 Holliston St Medway, MA 02053
Estimated Value: $577,000 - $700,000
3
Beds
1
Bath
1,766
Sq Ft
$357/Sq Ft
Est. Value
About This Home
This home is located at 96 Holliston St, Medway, MA 02053 and is currently estimated at $629,798, approximately $356 per square foot. 96 Holliston St is a home located in Norfolk County with nearby schools including John D. McGovern Elementary School, Burke-Memorial Elementary, and Medway Middle School.
Ownership History
Date
Name
Owned For
Owner Type
Purchase Details
Closed on
Nov 22, 2004
Sold by
Macgregor Michael B
Bought by
Macgregor Holly A
Current Estimated Value
Home Financials for this Owner
Home Financials are based on the most recent Mortgage that was taken out on this home.
Original Mortgage
$203,125
Outstanding Balance
$100,095
Interest Rate
5.8%
Mortgage Type
Purchase Money Mortgage
Estimated Equity
$529,703
Purchase Details
Closed on
Feb 23, 1996
Sold by
Sheehan Connie L
Bought by
Macgregor Michael B and Macgregor Holly A
Home Financials for this Owner
Home Financials are based on the most recent Mortgage that was taken out on this home.
Original Mortgage
$107,000
Interest Rate
7.04%
Mortgage Type
Purchase Money Mortgage
Create a Home Valuation Report for This Property
The Home Valuation Report is an in-depth analysis detailing your home's value as well as a comparison with similar homes in the area
Home Values in the Area
Average Home Value in this Area
Purchase History
| Date | Buyer | Sale Price | Title Company |
|---|---|---|---|
| Macgregor Holly A | $25,000 | -- | |
| Macgregor Michael B | $137,000 | -- |
Source: Public Records
Mortgage History
| Date | Status | Borrower | Loan Amount |
|---|---|---|---|
| Open | Macgregor Holly A | $203,125 | |
| Previous Owner | Macgregor Michael B | $107,000 | |
| Previous Owner | Macgregor Michael B | $25,000 |
Source: Public Records
Tax History Compared to Growth
Tax History
| Year | Tax Paid | Tax Assessment Tax Assessment Total Assessment is a certain percentage of the fair market value that is determined by local assessors to be the total taxable value of land and additions on the property. | Land | Improvement |
|---|---|---|---|---|
| 2025 | $7,098 | $498,100 | $263,000 | $235,100 |
| 2024 | $7,173 | $498,100 | $263,000 | $235,100 |
| 2023 | $6,792 | $426,100 | $226,600 | $199,500 |
| 2022 | $6,774 | $400,100 | $202,300 | $197,800 |
| 2021 | $6,378 | $365,300 | $182,100 | $183,200 |
| 2020 | $6,039 | $345,100 | $161,900 | $183,200 |
| 2019 | $5,770 | $340,000 | $161,900 | $178,100 |
| 2018 | $5,646 | $319,700 | $141,600 | $178,100 |
| 2017 | $2,586 | $144,300 | $131,500 | $12,800 |
| 2016 | $4,531 | $250,200 | $126,700 | $123,500 |
| 2015 | $4,430 | $242,900 | $119,400 | $123,500 |
| 2014 | $4,101 | $217,700 | $116,700 | $101,000 |
Source: Public Records
Map
Nearby Homes
- 3 Meryl St
- 106 Holliston St
- 12 Lovering St
- 22 Sunset Dr
- 50 Main St
- 36 Lovering St
- 14 Heritage Dr
- 1 Walnut Ln
- 20 Broad St Unit 6
- 20 Broad St Unit A
- 20 Broad St Unit 4
- 30 Broken Tree Rd
- 280 Village St Unit D2
- 19 Sycamore Way Unit L40
- 4 Shaw St
- 176 Main St Unit 3
- 14 Sanford St Unit 15
- 9 Sanford St
- 28 Wellington St
- 116 Winthrop St