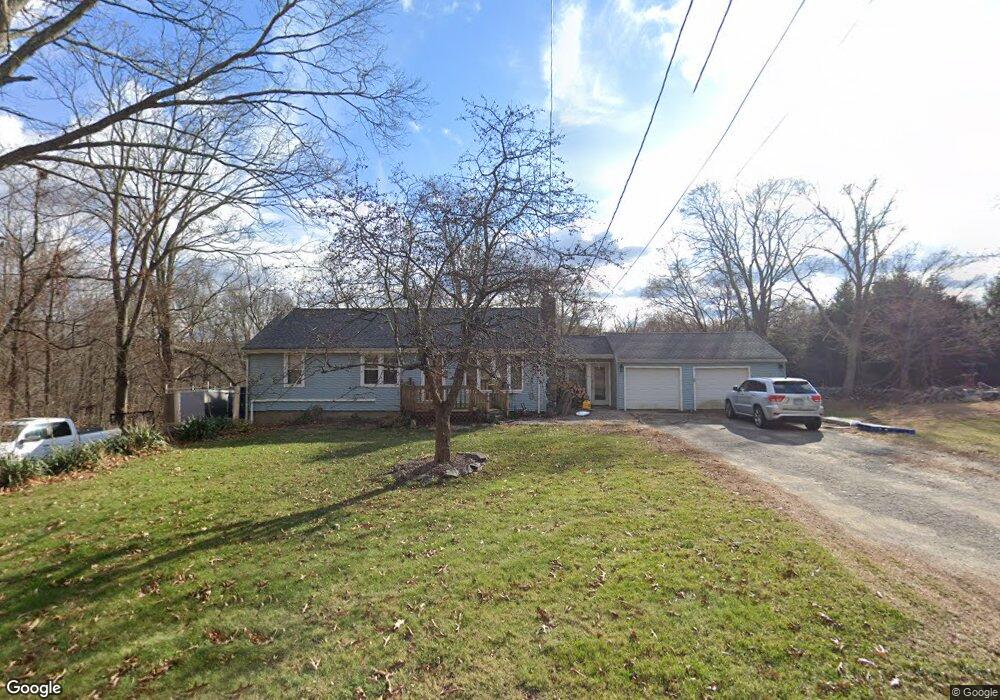
96 Hunt Rd Columbia, CT 06237
Estimated Value: $346,832 - $375,000
4
Beds
1
Bath
1,344
Sq Ft
$269/Sq Ft
Est. Value
About This Home
This home is located at 96 Hunt Rd, Columbia, CT 06237 and is currently estimated at $361,958, approximately $269 per square foot. 96 Hunt Rd is a home located in Tolland County with nearby schools including Horace W. Porter School.
Ownership History
Date
Name
Owned For
Owner Type
Purchase Details
Closed on
Jun 3, 2004
Sold by
Equity Const Llc
Bought by
Tarbell Allyn and Tarbell Lucille
Current Estimated Value
Home Financials for this Owner
Home Financials are based on the most recent Mortgage that was taken out on this home.
Original Mortgage
$155,800
Outstanding Balance
$75,854
Interest Rate
5.94%
Estimated Equity
$286,104
Purchase Details
Closed on
Feb 27, 2004
Sold by
Leblanc Norman and Lorraine Leblanc M
Bought by
Equity Constr
Home Financials for this Owner
Home Financials are based on the most recent Mortgage that was taken out on this home.
Original Mortgage
$225,000
Interest Rate
8.75%
Create a Home Valuation Report for This Property
The Home Valuation Report is an in-depth analysis detailing your home's value as well as a comparison with similar homes in the area
Home Values in the Area
Average Home Value in this Area
Purchase History
| Date | Buyer | Sale Price | Title Company |
|---|---|---|---|
| Tarbell Allyn | $164,000 | -- | |
| Equity Constr | $200,000 | -- |
Source: Public Records
Mortgage History
| Date | Status | Borrower | Loan Amount |
|---|---|---|---|
| Open | Equity Constr | $55,000 | |
| Open | Equity Constr | $155,800 | |
| Previous Owner | Equity Constr | $225,000 |
Source: Public Records
Tax History Compared to Growth
Tax History
| Year | Tax Paid | Tax Assessment Tax Assessment Total Assessment is a certain percentage of the fair market value that is determined by local assessors to be the total taxable value of land and additions on the property. | Land | Improvement |
|---|---|---|---|---|
| 2025 | $4,612 | $157,570 | $44,660 | $112,910 |
| 2024 | $4,431 | $157,570 | $44,660 | $112,910 |
| 2023 | $4,083 | $157,570 | $44,660 | $112,910 |
| 2022 | $4,076 | $157,570 | $44,660 | $112,910 |
| 2021 | $4,426 | $150,900 | $45,100 | $105,800 |
| 2020 | $4,426 | $150,900 | $45,100 | $105,800 |
| 2019 | $4,426 | $150,900 | $45,100 | $105,800 |
| 2018 | $4,426 | $150,900 | $45,100 | $105,800 |
| 2017 | $4,358 | $150,900 | $45,100 | $105,800 |
| 2016 | $4,135 | $150,700 | $45,100 | $105,600 |
| 2015 | $4,021 | $148,200 | $45,100 | $103,100 |
| 2014 | $3,890 | $143,400 | $45,100 | $98,300 |
Source: Public Records
Map
Nearby Homes