
Landlord's Agent in 2016
Amy March
The Firm
(617) 947-0022
17 in this area
139 Total Sales
Estimated Value: $436,000 - $608,000
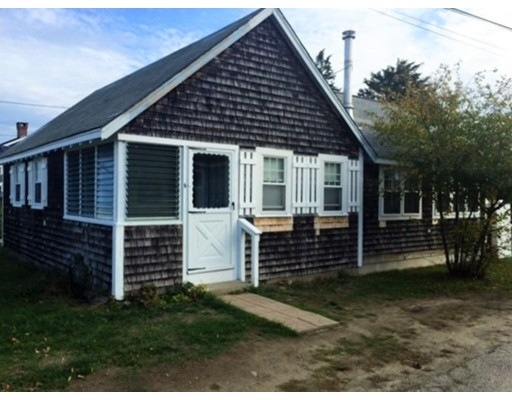
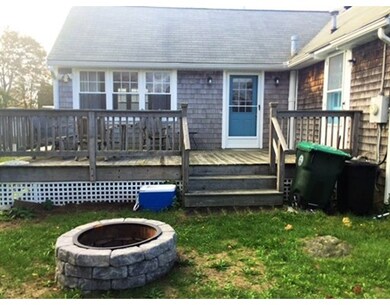
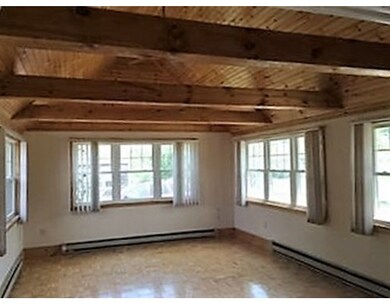
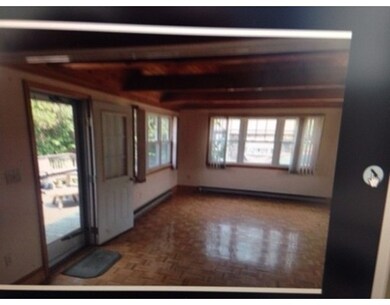
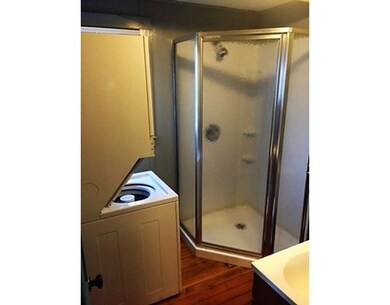
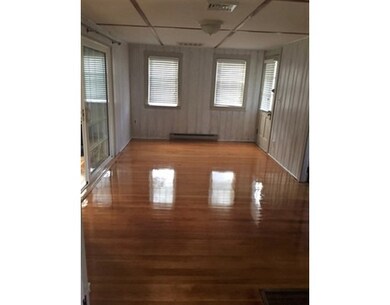
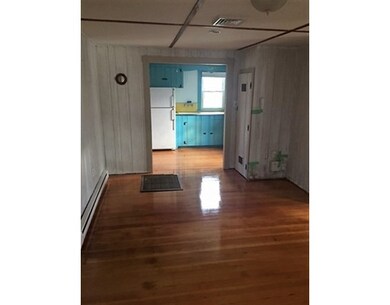
Adorable home available for year round rental. This property is short walk to the areas best restaurants, beach, marina and the newly rebuilt Peter Igo Park with Kayak launch, tennis and basketball courts. There is a larger living room with cathedral ceiling and wood stove (former tenant used as the master bedroom), another living area, small kitchen, full bath with laundry and 3 small bedrooms (twins would be likely in two of them). This home has newly refinished hardwood floors and a brand new heating system complete with central air. There is a 10x20 attached deck with sliders from the family room perfect for summer entertaining at the beach, a managable yard with firepit and driveway for parking. A great opportunity to be in Marshfield with all it has to offer!
Home Type
Other
Est. Annual Taxes
$4,187
Year Built
1945
Lot Details
0
| Date | Buyer | Sale Price | Title Company |
|---|---|---|---|
| Wright Jeffrey L | $200,000 | -- | |
| Gibbons James M | $50,000 | -- |
| Date | Status | Borrower | Loan Amount |
|---|---|---|---|
| Open | Wright Jeffrey L | $160,000 | |
| Closed | Wright Jeffrey L | $160,000 |
| Date | Event | Price | List to Sale | Price per Sq Ft | Prior Sale |
|---|---|---|---|---|---|
| 12/01/2016 12/01/16 | Rented | $1,600 | 0.0% | -- | |
| 11/16/2016 11/16/16 | Under Contract | -- | -- | -- | |
| 11/02/2016 11/02/16 | Price Changed | $1,600 | -5.9% | $2 / Sq Ft | |
| 10/20/2016 10/20/16 | For Rent | $1,700 | 0.0% | -- | |
| 08/28/2015 08/28/15 | Sold | $200,000 | 0.0% | $255 / Sq Ft | View Prior Sale |
| 07/31/2015 07/31/15 | Pending | -- | -- | -- | |
| 07/12/2015 07/12/15 | Off Market | $200,000 | -- | -- | |
| 05/18/2015 05/18/15 | For Sale | $207,000 | -- | $264 / Sq Ft |
| Year | Tax Paid | Tax Assessment Tax Assessment Total Assessment is a certain percentage of the fair market value that is determined by local assessors to be the total taxable value of land and additions on the property. | Land | Improvement |
|---|---|---|---|---|
| 2025 | $4,187 | $422,900 | $317,400 | $105,500 |
| 2024 | $4,128 | $397,300 | $297,500 | $99,800 |
| 2023 | $3,939 | $350,000 | $267,800 | $82,200 |
| 2022 | $3,939 | $304,200 | $228,100 | $76,100 |
| 2021 | $3,783 | $286,800 | $218,200 | $68,600 |
| 2020 | $3,375 | $253,200 | $188,400 | $64,800 |
| 2019 | $3,338 | $249,500 | $188,400 | $61,100 |
| 2018 | $3,336 | $249,500 | $188,400 | $61,100 |
| 2017 | $3,149 | $229,500 | $178,500 | $51,000 |
| 2016 | $3,011 | $216,900 | $168,600 | $48,300 |
| 2015 | $2,883 | $216,900 | $168,600 | $48,300 |
| 2014 | $2,883 | $216,900 | $168,600 | $48,300 |
Landlord's Agent in 2016
Amy March
The Firm
(617) 947-0022
17 in this area
139 Total Sales
Seller's Agent in 2015
Janice Walker
Conway - Marshfield
(781) 771-3628
2 in this area
16 Total Sales
Source: MLS Property Information Network (MLS PIN)
MLS Number: 72084156
APN: MARS-000006N-000006-000037
Disclaimer: Certain information contained herein is derived from information provided by parties other than Homes.com. All information provided is deemed reliable, but is not guaranteed to be accurate and should be independently verified.
![]() The property listing data and information, or the Images, set forth herein were provided to MLS Property Information Network, Inc. from third party sources, including sellers, lessors and public records, and were compiled by MLS Property Information Network, Inc. The property listing data and information, and the Images, are for the personal, non-commercial use of consumers having a good faith interest in purchasing or leasing listed properties of the type displayed to them and may not be used for any purpose other than to identify prospective properties which such consumers may have a good faith interest in purchasing or leasing. MLS Property Information Network, Inc. and its subscribers disclaim any and all representations and warranties as to the accuracy of the property listing data and information, or as to the accuracy of any of the Images, set forth herein.
The property listing data and information, or the Images, set forth herein were provided to MLS Property Information Network, Inc. from third party sources, including sellers, lessors and public records, and were compiled by MLS Property Information Network, Inc. The property listing data and information, and the Images, are for the personal, non-commercial use of consumers having a good faith interest in purchasing or leasing listed properties of the type displayed to them and may not be used for any purpose other than to identify prospective properties which such consumers may have a good faith interest in purchasing or leasing. MLS Property Information Network, Inc. and its subscribers disclaim any and all representations and warranties as to the accuracy of the property listing data and information, or as to the accuracy of any of the Images, set forth herein.