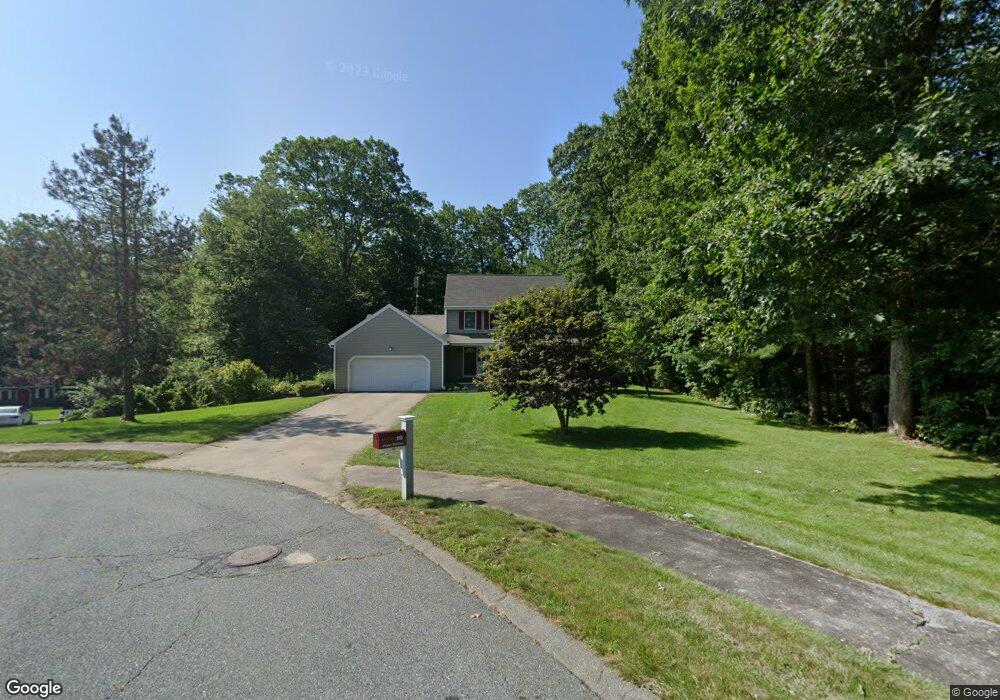
96 June St Northbridge, MA 01534
Estimated Value: $608,010 - $879,000
4
Beds
3
Baths
2,104
Sq Ft
$327/Sq Ft
Est. Value
About This Home
This home is located at 96 June St, Northbridge, MA 01534 and is currently estimated at $688,253, approximately $327 per square foot. 96 June St is a home located in Worcester County with nearby schools including Northbridge Elementary School, Northbridge Middle School, and Northbridge High School.
Ownership History
Date
Name
Owned For
Owner Type
Purchase Details
Closed on
Feb 6, 2026
Sold by
Donoghue Daniel John Est and Hoyeflaherty
Bought by
Flaherty Jessica
Current Estimated Value
Purchase Details
Closed on
Mar 27, 1997
Sold by
Heritage Park Dev Corp
Bought by
Maccaline Anthony and Maccaline Sonja
Create a Home Valuation Report for This Property
The Home Valuation Report is an in-depth analysis detailing your home's value as well as a comparison with similar homes in the area
Home Values in the Area
Average Home Value in this Area
Purchase History
| Date | Buyer | Sale Price | Title Company |
|---|---|---|---|
| Flaherty Jessica | $258,000 | -- | |
| Maccaline Anthony | $232,436 | -- | |
| Maccaline Anthony | $232,436 | -- |
Source: Public Records
Mortgage History
| Date | Status | Borrower | Loan Amount |
|---|---|---|---|
| Previous Owner | Maccaline Anthony | $60,000 | |
| Previous Owner | Maccaline Anthony | $60,000 |
Source: Public Records
Tax History
| Year | Tax Paid | Tax Assessment Tax Assessment Total Assessment is a certain percentage of the fair market value that is determined by local assessors to be the total taxable value of land and additions on the property. | Land | Improvement |
|---|---|---|---|---|
| 2025 | $6,633 | $562,600 | $190,000 | $372,600 |
| 2024 | $6,434 | $532,200 | $190,000 | $342,200 |
| 2023 | $6,234 | $481,000 | $174,300 | $306,700 |
| 2022 | $5,779 | $419,700 | $134,700 | $285,000 |
| 2021 | $5,682 | $392,100 | $128,500 | $263,600 |
| 2020 | $5,265 | $380,400 | $128,500 | $251,900 |
| 2019 | $4,746 | $365,900 | $128,500 | $237,400 |
| 2018 | $2,351 | $351,000 | $122,300 | $228,700 |
| 2017 | $4,514 | $333,600 | $122,300 | $211,300 |
| 2016 | $4,425 | $321,800 | $111,200 | $210,600 |
| 2015 | $4,306 | $321,800 | $111,200 | $210,600 |
| 2014 | $4,267 | $321,800 | $111,200 | $210,600 |
Source: Public Records
Map
Nearby Homes
- 220 Alana Dr
- 138 Fir Hill Ln
- 240 Roosevelt Dr
- 2428-2430 Providence Rd
- 24 Mcquades Ln
- 2294 Providence Rd
- 86 Mikes Way Unit 86
- 2248 Providence Rd
- 35 School St Unit 35
- 69-71 Providence Rd
- 90 Windstone Dr
- 659 Highland St
- 0 Emond St Unit 1
- 0 Emond St Unit 73480228
- 2120 Providence Rd
- 711 Samuel Dr
- 7 Central Turnpike
- 5 S Main St
- 17 Keryn Ct
- 578 Carpenter Rd
Your Personal Tour Guide
Ask me questions while you tour the home.