96 Masonicus Rd Mahwah, NJ 07430
Mahwah AreaEstimated Value: $1,036,263 - $1,330,000
About This Home
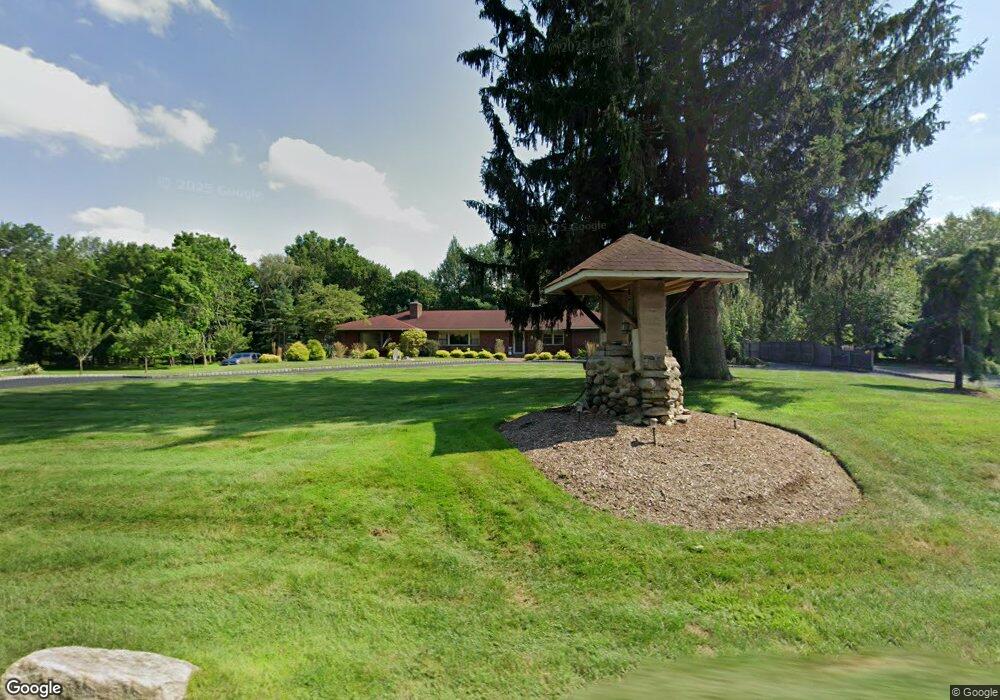
This home is located at 96 Masonicus Rd, Mahwah, NJ 07430 and is currently estimated at $1,162,816, approximately $396 per square foot. 96 Masonicus Rd is a home located in Bergen County with nearby schools including Mahwah High School and ONESCHOOL GLOBAL-NEW YORK.
Ownership History
We collect this data history from publicly available records. To have your information removed, we recommend requesting removal directly through your county’s website.
Purchase Details
Purchase Details
Home Values in the Area
Average Home Value in this Area
Purchase History
We collect this data history from publicly available records. To have your information removed, we recommend requesting removal directly through your county’s website.
| Date | Buyer | Sale Price | Title Company |
|---|---|---|---|
| -- | None Listed On Document | ||
| -- | None Available |
Tax History
We collect this data history from publicly available records. To have your information removed, we recommend requesting removal directly through your county’s website.
| Year | Tax Paid | Tax Assessment Tax Assessment Total Assessment is a certain percentage of the fair market value that is determined by local assessors to be the total taxable value of land and additions on the property. | Land | Improvement |
|---|---|---|---|---|
| 2026 | $12,585 | $591,700 | $317,900 | $273,800 |
| 2025 | $12,213 | $591,700 | $317,900 | $273,800 |
| 2024 | $12,053 | $591,700 | $317,900 | $273,800 |
| 2023 | $11,418 | $591,700 | $317,900 | $273,800 |
| 2022 | $11,668 | $591,700 | $317,900 | $273,800 |
| 2021 | $11,294 | $591,700 | $317,900 | $273,800 |
| 2020 | $11,266 | $591,700 | $317,900 | $273,800 |
| 2019 | $10,893 | $591,700 | $317,900 | $273,800 |
| 2018 | $10,739 | $591,700 | $317,900 | $273,800 |
| 2017 | $10,568 | $591,700 | $317,900 | $273,800 |
| 2016 | $10,337 | $591,700 | $317,900 | $273,800 |
| 2015 | $9,945 | $591,700 | $317,900 | $273,800 |
| 2014 | $9,773 | $591,700 | $317,900 | $273,800 |
Map
- 224 Westervelt Ln
- 44 Brookwood Dr
- 281 E Crescent Ave
- 227 Westervelt Ln Unit 227
- 15 Roxbury Rd
- 143 Fisher Rd
- 182 Airmont Ave
- 134 Fisher Rd
- 72 Sparrowbush Rd
- 18 Stonewall Ct
- 81 E Crescent Ave
- 6 Romopock Ct
- 1047 Cambridge Ct
- 1116 Hyde Park Ct
- 1069 Cambridge Ct
- 47 Cortland Trail
- 22 Glen Carl Rd
- 335 Cambridge Dr
- 1399 York St
- 1317 Paddington Rd Unit 18C
- 11 Cider Ct
- 12 Aspen Ct
- 101 Masonicus Rd
- 10 Cider Ct
- 214 E Crescent Ave
- 222 E Crescent Ave
- 80 Masonicus Rd
- 15 Aspen Ct
- 230 E Crescent Ave
- 15 Cider Ct
- 12 Bayberry Dr
- 68 Masonicus Rd
- 73 Masonicus Rd
- 15 Bayberry Dr
- 189 Van Winkle Ln
- 238 E Crescent Ave
- 11 Aspen Ct
- 4 Aspen Ct
- 225 E Crescent Ave
- 213 E Crescent Ave
Ask me questions while you tour the home.