96 Mill Brook Ave Walpole, MA 02081
Walpole AreaEstimated Value: $1,136,355 - $1,306,000
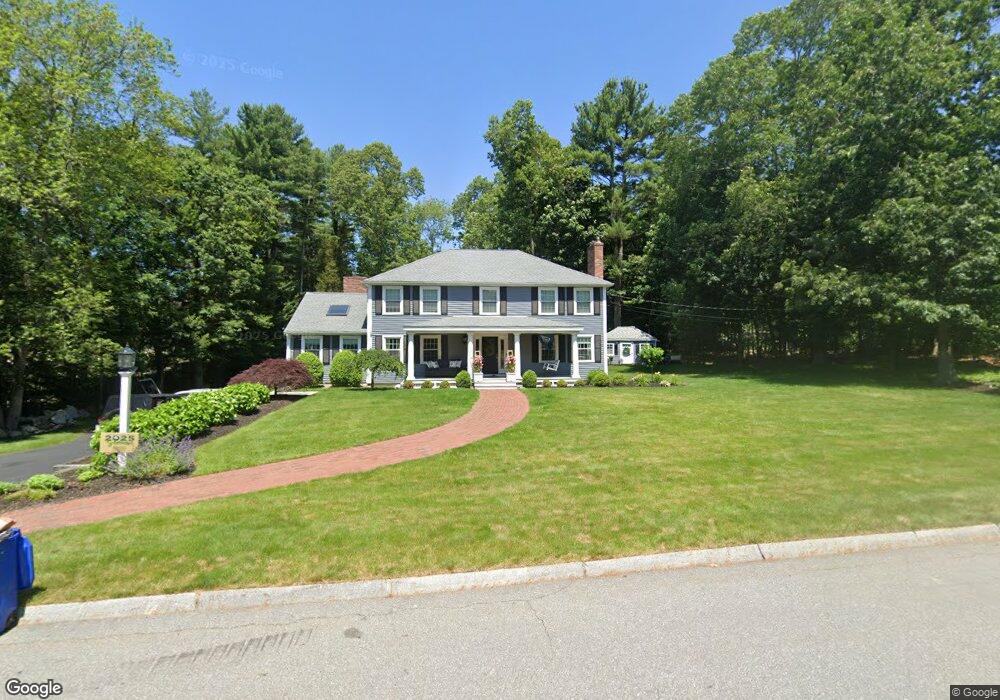
About This Home
This home is located at 96 Mill Brook Ave, Walpole, MA 02081 and is currently estimated at $1,215,839, approximately $443 per square foot. 96 Mill Brook Ave is a home located in Norfolk County with nearby schools including Elm Street School, Eleanor N. Johnson Middle School, and Walpole High School.
Ownership History
We collect this data history from publicly available records. To have your information removed, we recommend requesting removal directly through your county’s website.
Purchase Details
Purchase Details
Purchase Details
Purchase Details
Home Values in the Area
Average Home Value in this Area
Purchase History
We collect this data history from publicly available records. To have your information removed, we recommend requesting removal directly through your county’s website.
| Date | Buyer | Sale Price | Title Company |
|---|---|---|---|
| $625,000 | -- | ||
| $520,000 | -- | ||
| $265,700 | -- | ||
| $255,500 | -- |
Mortgage History
We collect this data history from publicly available records. To have your information removed, we recommend requesting removal directly through your county’s website.
| Date | Status | Borrower | Loan Amount |
|---|---|---|---|
| Open | $487,000 | ||
| Closed | $417,000 | ||
| Closed | $130,000 | ||
| Closed | $400,000 | ||
| Closed | $417,000 | ||
| Previous Owner | $90,000 |
Tax History
We collect this data history from publicly available records. To have your information removed, we recommend requesting removal directly through your county’s website.
| Year | Tax Paid | Tax Assessment Tax Assessment Total Assessment is a certain percentage of the fair market value that is determined by local assessors to be the total taxable value of land and additions on the property. | Land | Improvement |
|---|---|---|---|---|
| 2025 | $12,827 | $999,800 | $412,100 | $587,700 |
| 2024 | $12,399 | $937,900 | $396,500 | $541,400 |
| 2023 | $11,754 | $846,200 | $344,600 | $501,600 |
| 2022 | $10,969 | $758,600 | $319,200 | $439,400 |
| 2021 | $10,787 | $726,900 | $301,400 | $425,500 |
| 2020 | $10,292 | $686,600 | $284,100 | $402,500 |
| 2019 | $9,948 | $658,800 | $273,300 | $385,500 |
| 2018 | $9,819 | $643,000 | $263,000 | $380,000 |
| 2017 | $9,305 | $607,000 | $252,700 | $354,300 |
| 2016 | $9,076 | $583,300 | $245,200 | $338,100 |
| 2015 | $8,844 | $563,300 | $234,900 | $328,400 |
| 2014 | $8,430 | $534,900 | $234,900 | $300,000 |
Map
- 96 Millbrook Ave
- 110 Millbrook Ave
- 120 Millbrook Ave
- 110 Mill Brook Ave
- 154 Millbrook Ave
- 423 High St
- 363 High St
- 400 High St
- 92 Millbrook Ave
- 92 Mill Brook Ave
- 430 High St
- 95 Mill Brook Ave
- 109 Millbrook Ave
- 157 Millbrook Ave
- 147 Lester Gray Dr
- 115 Millbrook Ave
- 155 Millbrook Ave
- 129 Millbrook Ave
- 360 High St
- 333 High St
Ask me questions while you tour the home.