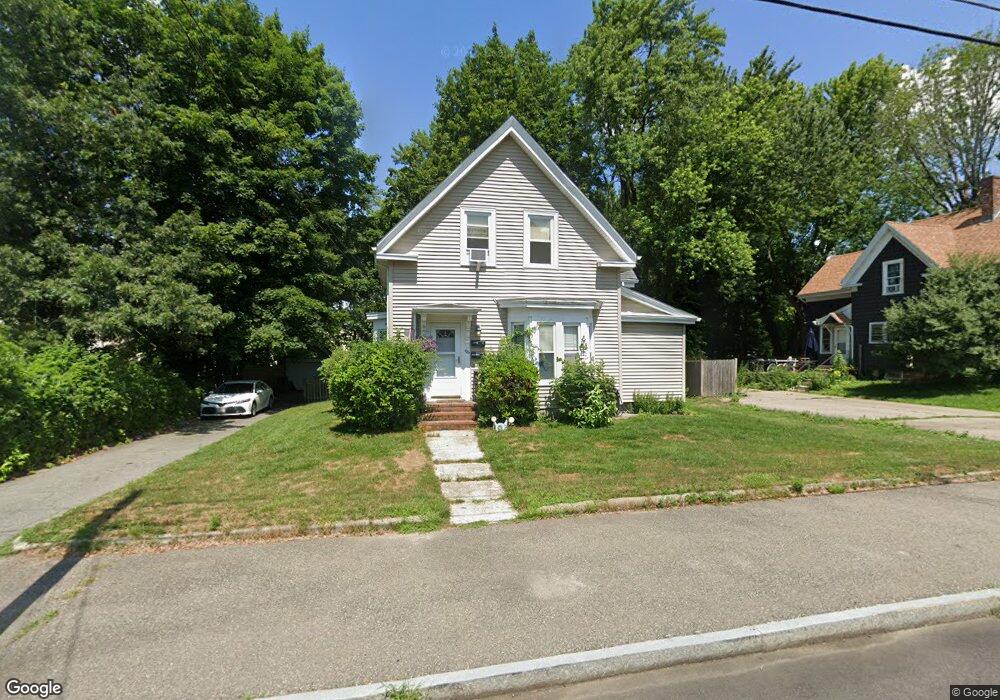
96 Monk St Stoughton, MA 02072
Estimated Value: $620,345 - $784,000
4
Beds
2
Baths
1,912
Sq Ft
$373/Sq Ft
Est. Value
About This Home
This home is located at 96 Monk St, Stoughton, MA 02072 and is currently estimated at $713,836, approximately $373 per square foot. 96 Monk St is a home located in Norfolk County with nearby schools including Wilkins Elementary School, O'Donnell Middle School, and Stoughton High School.
Ownership History
Date
Name
Owned For
Owner Type
Purchase Details
Closed on
Sep 16, 2020
Sold by
Danna Paul F and Danna Kimberly A
Bought by
Danna Paul F
Current Estimated Value
Home Financials for this Owner
Home Financials are based on the most recent Mortgage that was taken out on this home.
Original Mortgage
$159,100
Outstanding Balance
$127,507
Interest Rate
2.9%
Mortgage Type
New Conventional
Estimated Equity
$586,329
Purchase Details
Closed on
May 15, 2000
Sold by
Penardi Arthur L and Penardi Evelyn T
Bought by
Danna Paul F
Home Financials for this Owner
Home Financials are based on the most recent Mortgage that was taken out on this home.
Original Mortgage
$144,000
Interest Rate
8.21%
Mortgage Type
Purchase Money Mortgage
Create a Home Valuation Report for This Property
The Home Valuation Report is an in-depth analysis detailing your home's value as well as a comparison with similar homes in the area
Home Values in the Area
Average Home Value in this Area
Purchase History
| Date | Buyer | Sale Price | Title Company |
|---|---|---|---|
| Danna Paul F | -- | None Available | |
| Danna Paul F | -- | None Available | |
| Danna Paul F | -- | None Available | |
| Danna Paul F | $164,000 | -- |
Source: Public Records
Mortgage History
| Date | Status | Borrower | Loan Amount |
|---|---|---|---|
| Open | Danna Paul F | $159,100 | |
| Closed | Danna Paul F | $159,100 | |
| Previous Owner | Danna Paul F | $180,000 | |
| Previous Owner | Danna Paul F | $144,000 |
Source: Public Records
Tax History Compared to Growth
Tax History
| Year | Tax Paid | Tax Assessment Tax Assessment Total Assessment is a certain percentage of the fair market value that is determined by local assessors to be the total taxable value of land and additions on the property. | Land | Improvement |
|---|---|---|---|---|
| 2025 | $6,060 | $489,500 | $212,300 | $277,200 |
| 2024 | $5,992 | $470,700 | $193,500 | $277,200 |
| 2023 | $5,953 | $439,300 | $179,800 | $259,500 |
| 2022 | $5,682 | $394,300 | $164,400 | $229,900 |
| 2021 | $5,419 | $358,900 | $149,000 | $209,900 |
| 2020 | $4,982 | $334,600 | $143,800 | $190,800 |
| 2019 | $4,987 | $325,100 | $143,800 | $181,300 |
| 2018 | $4,686 | $316,400 | $137,000 | $179,400 |
| 2017 | $4,347 | $300,000 | $130,100 | $169,900 |
| 2016 | $3,873 | $258,700 | $119,900 | $138,800 |
| 2015 | $3,810 | $251,800 | $113,000 | $138,800 |
| 2014 | $3,595 | $228,400 | $102,700 | $125,700 |
Source: Public Records
Map
Nearby Homes
- 58 Union St Unit 15
- 6 Grove St
- 11 Monk St
- 26 Faxon St Unit 2
- 36 Pleasant Dr Unit 42
- 5-9 Morton Square
- 15-17 Morton Square
- 15 Jones Terrace Unit 2
- 17 Jones Terrace Unit 4
- 81 Summer St Unit 1
- 52 Adams St
- 310 Lincoln St
- 702 Central St
- 62 Kinsley St
- 79 Kinsley St
- 59 Summer Ave
- 68 Crescent Ave
- 18 Britton St
- 73 Crescent Ave
- 959 Washington St
- 96 Monk St Unit 2
- 106 Monk St
- 106 Monk St Unit 1
- 106 Monk St Unit 2
- 63 Lincoln St
- 97 Monk St
- 67 Union St
- 79 Monk St
- Lot 61 McEachron Dr
- Lot 77 Scofield Dr
- Lot 75 Scofield Dr
- Lot 79 Scofield Dr
- Lot 85 Scofield Dr
- Lot 97 Scofield Dr
- 94 Grove St
- 57 Union St
- 40 Lincoln St
- 40 Lincoln St Unit 1
- 67 Monk St
- 58 Union St Unit 18