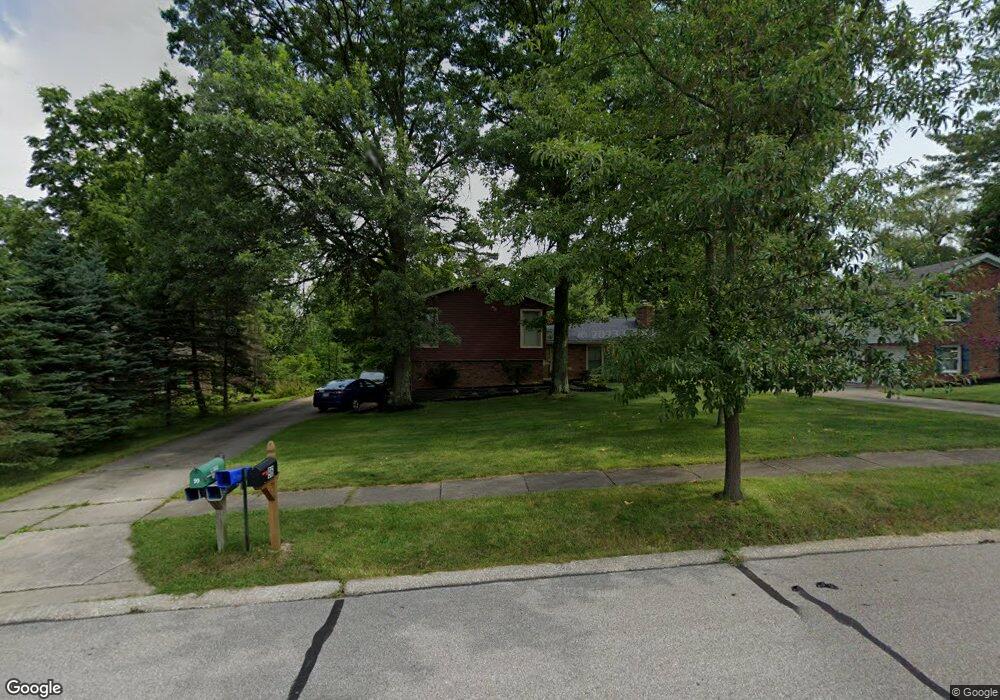
96 N Park Dr Aurora, OH 44202
Estimated Value: $334,278 - $365,000
3
Beds
3
Baths
1,608
Sq Ft
$215/Sq Ft
Est. Value
About This Home
This home is located at 96 N Park Dr, Aurora, OH 44202 and is currently estimated at $345,070, approximately $214 per square foot. 96 N Park Dr is a home located in Portage County with nearby schools including Miller Elementary School, Leighton Elementary School, and Craddock/Miller Elementary School.
Ownership History
Date
Name
Owned For
Owner Type
Purchase Details
Closed on
Mar 24, 1997
Sold by
Gregg Scott K
Bought by
Salzano Alfred D and Salzano Maureen P
Current Estimated Value
Home Financials for this Owner
Home Financials are based on the most recent Mortgage that was taken out on this home.
Original Mortgage
$115,900
Outstanding Balance
$14,154
Interest Rate
7.82%
Mortgage Type
New Conventional
Estimated Equity
$330,916
Purchase Details
Closed on
May 18, 1995
Sold by
Kennedy P Todd
Bought by
Gregg Scott K and Gregg Diane G
Home Financials for this Owner
Home Financials are based on the most recent Mortgage that was taken out on this home.
Original Mortgage
$129,500
Interest Rate
8.42%
Mortgage Type
New Conventional
Create a Home Valuation Report for This Property
The Home Valuation Report is an in-depth analysis detailing your home's value as well as a comparison with similar homes in the area
Home Values in the Area
Average Home Value in this Area
Purchase History
| Date | Buyer | Sale Price | Title Company |
|---|---|---|---|
| Salzano Alfred D | $144,900 | -- | |
| Gregg Scott K | $139,500 | -- |
Source: Public Records
Mortgage History
| Date | Status | Borrower | Loan Amount |
|---|---|---|---|
| Open | Salzano Alfred D | $115,900 | |
| Previous Owner | Gregg Scott K | $129,500 |
Source: Public Records
Tax History Compared to Growth
Tax History
| Year | Tax Paid | Tax Assessment Tax Assessment Total Assessment is a certain percentage of the fair market value that is determined by local assessors to be the total taxable value of land and additions on the property. | Land | Improvement |
|---|---|---|---|---|
| 2024 | $4,617 | $103,290 | $16,000 | $87,290 |
| 2023 | $4,399 | $80,120 | $16,000 | $64,120 |
| 2022 | $3,984 | $80,120 | $16,000 | $64,120 |
| 2021 | $4,006 | $80,120 | $16,000 | $64,120 |
| 2020 | $3,583 | $66,890 | $16,000 | $50,890 |
| 2019 | $3,611 | $66,890 | $16,000 | $50,890 |
| 2018 | $3,441 | $57,930 | $16,000 | $41,930 |
| 2017 | $3,441 | $57,930 | $16,000 | $41,930 |
| 2016 | $3,100 | $57,930 | $16,000 | $41,930 |
| 2015 | $3,188 | $57,930 | $16,000 | $41,930 |
| 2014 | $3,184 | $56,710 | $16,000 | $40,710 |
| 2013 | $3,164 | $56,710 | $16,000 | $40,710 |
Source: Public Records
Map
Nearby Homes
- 126 Greenbriar Dr
- 824 S Chillicothe Rd Unit 11
- 221 Greenbriar Dr
- 750 Hampton Cir Unit 2
- 69 E Mennonite Rd
- 985 Goldenrod Trail Unit 16K
- 334 Rainbows End
- 415 Normandy Ct
- 635 Prestige Woods Blvd
- 504-9 Concord Downs Cir Unit 9
- 179 Fox Run Trail
- 624 Russet Woods Ct
- 350 Aspen Ct
- 702-22 Fairington Dr
- 369 Fox Run Trail
- 711 Cross Creek Oval
- 682 Arbor Way
- 314 E Pioneer Trail
- 540 Bent Creek Oval
- 109 S Chillicothe Rd
- 106 N Park Dr
- 90 N Park Dr
- 116 N Park Dr
- 84 N Park Dr
- 99 N Park Dr
- 126 N Park Dr
- 119 N Park Dr
- 80 N Park Dr
- 83 N Park Dr
- 870 S Parkview Dr
- 890 S Parkview Dr
- 127 N Park Dr
- 134 N Park Dr
- 105 Greenbriar Dr
- 97 Greenbriar Dr
- 864 S Parkview Dr
- 129 Greenbriar Dr
- 858 S Parkview Dr
- 91 Greenbriar Dr
- 113 Greenbriar Dr