Estimated Value: $676,000 - $899,000
2
Beds
2
Baths
1,237
Sq Ft
$613/Sq Ft
Est. Value
About This Home
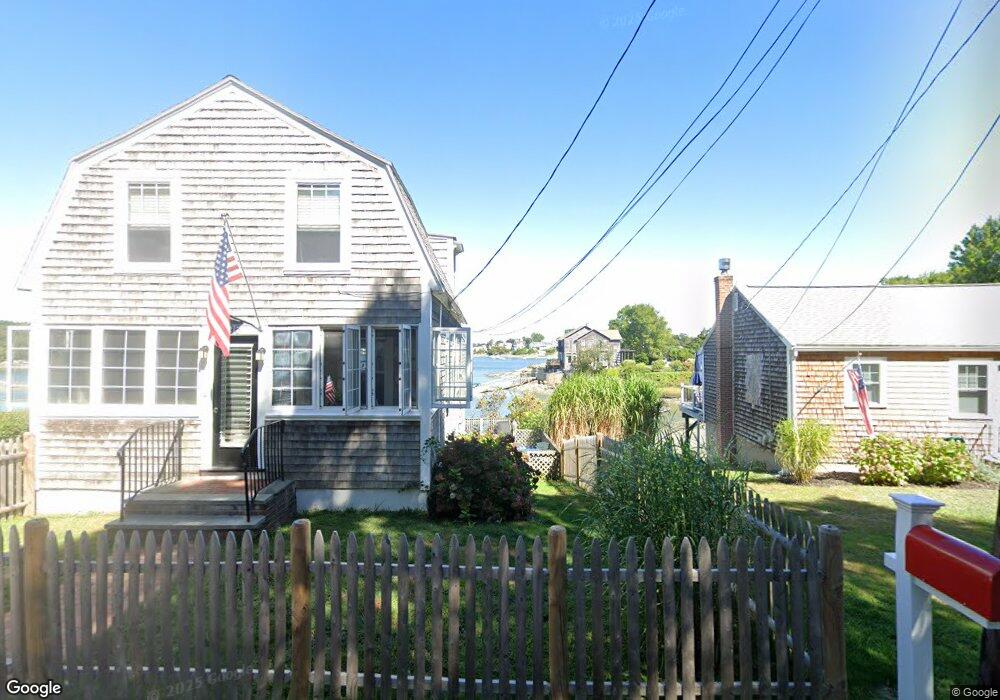
This home is located at 96 N Truro St, Hull, MA 02045 and is currently estimated at $758,816, approximately $613 per square foot. 96 N Truro St is a home located in Plymouth County with nearby schools including Lillian M. Jacobs Elementary School, Memorial Middle School, and Hull High School.
Ownership History
Date
Name
Owned For
Owner Type
Purchase Details
Closed on
Mar 28, 2000
Sold by
Russo Christopher J
Bought by
White Judith A
Current Estimated Value
Home Financials for this Owner
Home Financials are based on the most recent Mortgage that was taken out on this home.
Original Mortgage
$232,000
Interest Rate
8.31%
Mortgage Type
Purchase Money Mortgage
Purchase Details
Closed on
Sep 29, 1999
Sold by
Connolly Dorothy G and Lyons Francis C
Bought by
Russo Christopher J
Home Financials for this Owner
Home Financials are based on the most recent Mortgage that was taken out on this home.
Original Mortgage
$180,000
Interest Rate
7.85%
Mortgage Type
Purchase Money Mortgage
Create a Home Valuation Report for This Property
The Home Valuation Report is an in-depth analysis detailing your home's value as well as a comparison with similar homes in the area
Purchase History
| Date | Buyer | Sale Price | Title Company |
|---|---|---|---|
| White Judith A | $290,000 | -- | |
| Russo Christopher J | $225,000 | -- |
Source: Public Records
Mortgage History
| Date | Status | Borrower | Loan Amount |
|---|---|---|---|
| Open | Russo Christopher J | $231,000 | |
| Closed | Russo Christopher J | $232,000 | |
| Previous Owner | Russo Christopher J | $180,000 |
Source: Public Records
Tax History
| Year | Tax Paid | Tax Assessment Tax Assessment Total Assessment is a certain percentage of the fair market value that is determined by local assessors to be the total taxable value of land and additions on the property. | Land | Improvement |
|---|---|---|---|---|
| 2025 | $7,222 | $644,800 | $355,100 | $289,700 |
| 2024 | $6,674 | $572,900 | $329,600 | $243,300 |
| 2023 | $6,647 | $546,200 | $318,200 | $228,000 |
| 2022 | $6,479 | $516,700 | $301,100 | $215,600 |
| 2021 | $6,336 | $499,700 | $284,100 | $215,600 |
| 2020 | $6,118 | $462,400 | $272,700 | $189,700 |
| 2019 | $5,438 | $416,700 | $238,600 | $178,100 |
| 2018 | $5,690 | $393,500 | $238,600 | $154,900 |
| 2017 | $5,240 | $381,900 | $238,600 | $143,300 |
| 2016 | $5,148 | $381,900 | $238,600 | $143,300 |
| 2015 | $4,546 | $326,100 | $193,200 | $132,900 |
| 2014 | $4,667 | $336,500 | $193,200 | $143,300 |
Source: Public Records
Map
Nearby Homes
- 155 George Washington Blvd Unit 210
- 137 Hampton Cir
- 15 Lincoln Ave
- 127 Hampton Cir
- 23 Wyola Rd
- 22 Berkley Rd Unit B
- 3 3rd St
- 10 Berkley Rd Unit A
- 121 Nantasket Ave Unit 503
- 99 Nantasket Ave
- 10 Chestnut Place
- 120 Nantasket Ave Unit 207
- 120 Nantasket Ave Unit 204
- 120 Nantasket Ave Unit 304
- 120 Nantasket Ave Unit PH5
- 120 Nantasket Ave Unit 201
- 112 Martins Ln
- 1 Longbeach Ave Unit 202
- 2 Cliff Rd
- 62 Oceanside Dr
Your Personal Tour Guide
Ask me questions while you tour the home.