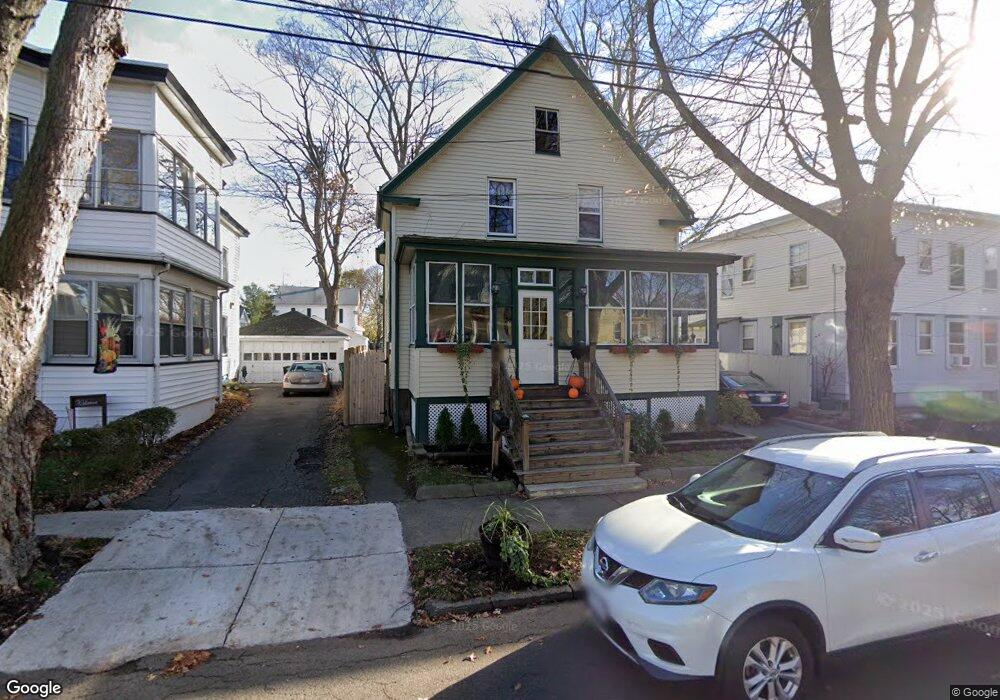
96 Newton Ave Lynn, MA 01905
Lower Boston Street NeighborhoodEstimated Value: $548,368 - $678,000
3
Beds
1
Bath
1,210
Sq Ft
$499/Sq Ft
Est. Value
About This Home
This home is located at 96 Newton Ave, Lynn, MA 01905 and is currently estimated at $603,342, approximately $498 per square foot. 96 Newton Ave is a home located in Essex County with nearby schools including North Park Elementary School, Lincoln-Thomson Elementary School, and William R. Fallon School.
Ownership History
Date
Name
Owned For
Owner Type
Purchase Details
Closed on
Dec 17, 2018
Sold by
Blais Kerry B and Blais Marc J
Bought by
Blais Kerry B
Current Estimated Value
Purchase Details
Closed on
Jun 30, 1995
Sold by
Fhlmc
Bought by
Blaise Marc J and Blaise Kerry B
Home Financials for this Owner
Home Financials are based on the most recent Mortgage that was taken out on this home.
Original Mortgage
$79,300
Interest Rate
7.8%
Mortgage Type
Purchase Money Mortgage
Purchase Details
Closed on
Mar 27, 1995
Sold by
Ecay John S and Ecay Fhlmc
Bought by
Fhlmc
Purchase Details
Closed on
Aug 3, 1988
Sold by
Fusco Patricia
Bought by
Ecay John S
Home Financials for this Owner
Home Financials are based on the most recent Mortgage that was taken out on this home.
Original Mortgage
$135,850
Interest Rate
10.36%
Mortgage Type
Purchase Money Mortgage
Create a Home Valuation Report for This Property
The Home Valuation Report is an in-depth analysis detailing your home's value as well as a comparison with similar homes in the area
Home Values in the Area
Average Home Value in this Area
Purchase History
| Date | Buyer | Sale Price | Title Company |
|---|---|---|---|
| Blais Kerry B | -- | -- | |
| Blais Kerry B | -- | -- | |
| Blais Kerry B | -- | -- | |
| Blaise Marc J | $83,500 | -- | |
| Blaise Marc J | $83,500 | -- | |
| Fhlmc | $72,000 | -- | |
| Fhlmc | $72,000 | -- | |
| Ecay John S | $143,000 | -- |
Source: Public Records
Mortgage History
| Date | Status | Borrower | Loan Amount |
|---|---|---|---|
| Previous Owner | Ecay John S | $79,300 | |
| Previous Owner | Ecay John S | $135,850 |
Source: Public Records
Tax History Compared to Growth
Tax History
| Year | Tax Paid | Tax Assessment Tax Assessment Total Assessment is a certain percentage of the fair market value that is determined by local assessors to be the total taxable value of land and additions on the property. | Land | Improvement |
|---|---|---|---|---|
| 2025 | $5,262 | $507,900 | $218,900 | $289,000 |
| 2024 | $4,901 | $465,400 | $192,200 | $273,200 |
| 2023 | $4,887 | $438,300 | $198,600 | $239,700 |
| 2022 | $4,498 | $361,900 | $147,000 | $214,900 |
| 2021 | $4,378 | $336,000 | $135,200 | $200,800 |
| 2020 | $4,226 | $315,400 | $130,100 | $185,300 |
| 2019 | $4,250 | $297,200 | $122,500 | $174,700 |
| 2018 | $4,274 | $282,100 | $135,200 | $146,900 |
| 2017 | $3,912 | $250,800 | $112,400 | $138,400 |
| 2016 | $3,822 | $236,200 | $105,200 | $131,000 |
| 2015 | $3,677 | $219,500 | $104,400 | $115,100 |
Source: Public Records
Map
Nearby Homes
- 92-94 Newton Ave
- 28 Wyman St
- 110 Holyoke St
- 100 Ashland St
- 35 Curran Rd
- 268 Walnut St
- 447 Boston St
- 20 Murray St
- 79 Laurel St
- 14 Atkinson St
- 86 Laurel St
- 10 Carnes St
- 19 Hood St
- 45 Cottage St Unit 3
- 32 Birch Brook Rd Unit 27
- 32 Birch Brook Rd Unit 16
- 32 Birch Brook Rd Unit 1
- 32 Birch Brook Rd Unit 25
- 32 Birch Brook Rd Unit 22
- 32 Birch Brook Rd Unit 28