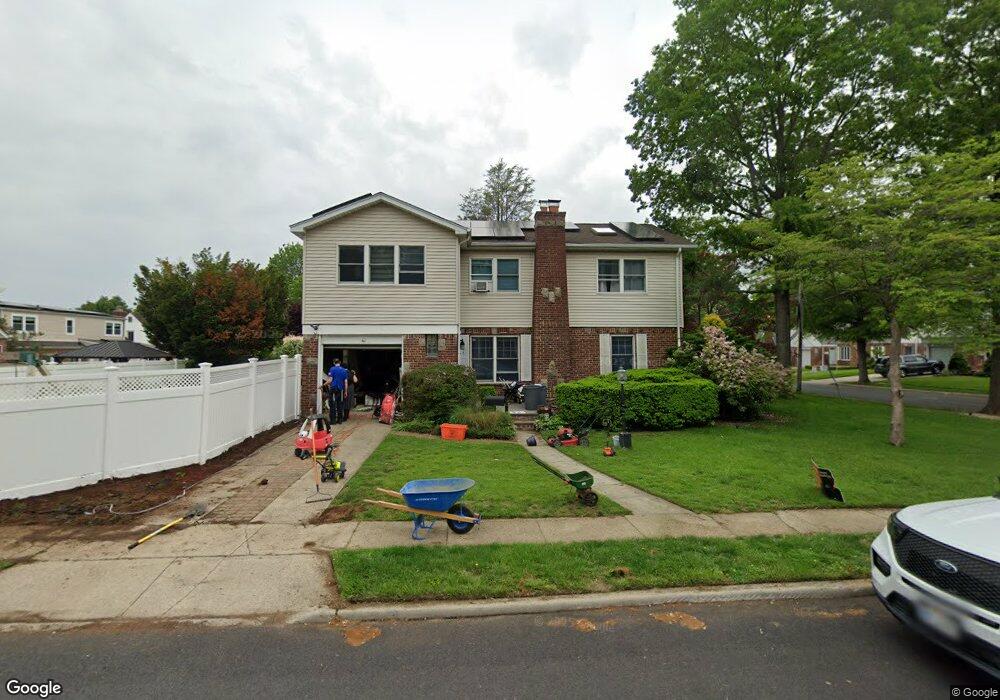
96 Oakland Ave West Hempstead, NY 11552
Estimated Value: $874,036 - $893,000
4
Beds
2
Baths
2,074
Sq Ft
$426/Sq Ft
Est. Value
About This Home
This home is located at 96 Oakland Ave, West Hempstead, NY 11552 and is currently estimated at $883,518, approximately $425 per square foot. 96 Oakland Ave is a home located in Nassau County with nearby schools including Chestnut Street School, West Hempstead Secondary School, and Hebrew Academy of Nassau County (HANC).
Ownership History
Date
Name
Owned For
Owner Type
Purchase Details
Closed on
Sep 17, 2021
Sold by
Valentino Donald P
Bought by
Glatzer Rochel and Glatzer Dovy
Current Estimated Value
Home Financials for this Owner
Home Financials are based on the most recent Mortgage that was taken out on this home.
Original Mortgage
$665,000
Outstanding Balance
$605,101
Interest Rate
2.8%
Mortgage Type
New Conventional
Estimated Equity
$278,417
Purchase Details
Closed on
Jan 26, 2010
Sold by
Valentino Donald P and Valentino Lauren
Bought by
Valentino Donald P
Home Financials for this Owner
Home Financials are based on the most recent Mortgage that was taken out on this home.
Original Mortgage
$110,332
Interest Rate
5.12%
Mortgage Type
Purchase Money Mortgage
Purchase Details
Closed on
Oct 6, 1998
Sold by
Geiselmann John B
Bought by
Valentino Donald P and Valentino Lauren
Purchase Details
Closed on
Jun 12, 1996
Sold by
Geiselmann Marguerite Est
Bought by
Geiselmann John
Create a Home Valuation Report for This Property
The Home Valuation Report is an in-depth analysis detailing your home's value as well as a comparison with similar homes in the area
Home Values in the Area
Average Home Value in this Area
Purchase History
| Date | Buyer | Sale Price | Title Company |
|---|---|---|---|
| Glatzer Rochel | $700,000 | Judicial Title | |
| Valentino Donald P | -- | -- | |
| Valentino Donald P | $170,000 | -- | |
| Geiselmann John | -- | -- |
Source: Public Records
Mortgage History
| Date | Status | Borrower | Loan Amount |
|---|---|---|---|
| Open | Glatzer Rochel | $665,000 | |
| Previous Owner | Valentino Donald P | $110,332 |
Source: Public Records
Tax History Compared to Growth
Tax History
| Year | Tax Paid | Tax Assessment Tax Assessment Total Assessment is a certain percentage of the fair market value that is determined by local assessors to be the total taxable value of land and additions on the property. | Land | Improvement |
|---|---|---|---|---|
| 2025 | $13,313 | $519 | $243 | $276 |
| 2024 | $4,647 | $560 | $262 | $298 |
| 2023 | $14,496 | $587 | $274 | $313 |
| 2022 | $14,496 | $571 | $267 | $304 |
| 2021 | $19,928 | $561 | $262 | $299 |
| 2020 | $16,432 | $963 | $539 | $424 |
| 2019 | $5,639 | $963 | $539 | $424 |
| 2018 | $5,373 | $963 | $0 | $0 |
| 2017 | $8,345 | $963 | $539 | $424 |
| 2016 | $12,744 | $963 | $539 | $424 |
| 2015 | $4,080 | $963 | $539 | $424 |
| 2014 | $4,080 | $963 | $539 | $424 |
| 2013 | $3,818 | $963 | $539 | $424 |
Source: Public Records
Map
Nearby Homes