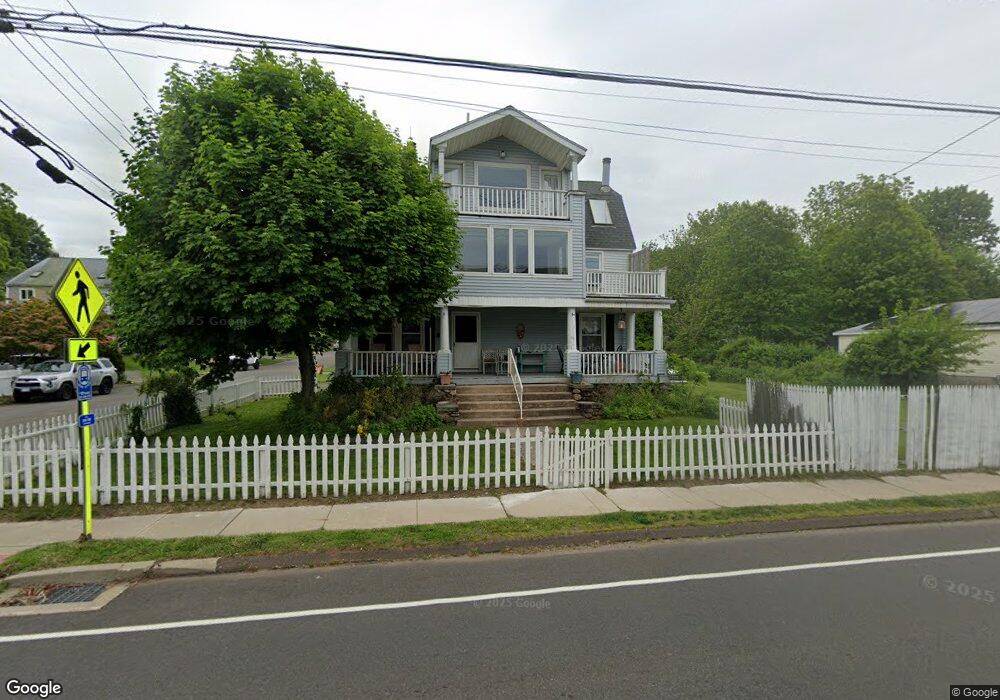
96 Ocean Ave West Haven, CT 06516
West Shore NeighborhoodEstimated Value: $554,000 - $712,854
3
Beds
3
Baths
2,750
Sq Ft
$230/Sq Ft
Est. Value
About This Home
This home is located at 96 Ocean Ave, West Haven, CT 06516 and is currently estimated at $631,464, approximately $229 per square foot. 96 Ocean Ave is a home located in New Haven County with nearby schools including Carrigan 5/6 Intermediate School, Harry M. Bailey Middle School, and West Haven High School.
Ownership History
Date
Name
Owned For
Owner Type
Purchase Details
Closed on
Aug 21, 2017
Sold by
Wilmington Svngs Fund
Bought by
Gordon Tia M
Current Estimated Value
Home Financials for this Owner
Home Financials are based on the most recent Mortgage that was taken out on this home.
Original Mortgage
$300,702
Outstanding Balance
$250,913
Interest Rate
3.96%
Mortgage Type
FHA
Estimated Equity
$380,551
Purchase Details
Closed on
Jul 15, 1999
Sold by
Conzo Joseph and Conzo Joseph
Bought by
Hebert Nicolai
Home Financials for this Owner
Home Financials are based on the most recent Mortgage that was taken out on this home.
Original Mortgage
$215,650
Interest Rate
7.39%
Mortgage Type
Purchase Money Mortgage
Create a Home Valuation Report for This Property
The Home Valuation Report is an in-depth analysis detailing your home's value as well as a comparison with similar homes in the area
Home Values in the Area
Average Home Value in this Area
Purchase History
| Date | Buyer | Sale Price | Title Company |
|---|---|---|---|
| Gordon Tia M | $260,000 | -- | |
| Gordon Tia M | $260,000 | -- | |
| Hebert Nicolai | $227,000 | -- | |
| Hebert Nicolai | $227,000 | -- |
Source: Public Records
Mortgage History
| Date | Status | Borrower | Loan Amount |
|---|---|---|---|
| Open | Hebert Nicolai | $300,702 | |
| Closed | Hebert Nicolai | $300,702 | |
| Previous Owner | Hebert Nicolai | $212,000 | |
| Previous Owner | Hebert Nicolai | $215,650 |
Source: Public Records
Tax History
| Year | Tax Paid | Tax Assessment Tax Assessment Total Assessment is a certain percentage of the fair market value that is determined by local assessors to be the total taxable value of land and additions on the property. | Land | Improvement |
|---|---|---|---|---|
| 2025 | $11,863 | $360,920 | $119,980 | $240,940 |
| 2024 | $11,356 | $242,340 | $83,160 | $159,180 |
| 2023 | $10,977 | $243,390 | $83,160 | $160,230 |
| 2022 | $10,780 | $243,390 | $83,160 | $160,230 |
| 2021 | $10,780 | $243,390 | $83,160 | $160,230 |
| 2020 | $10,613 | $218,330 | $76,580 | $141,750 |
| 2019 | $10,274 | $218,330 | $76,580 | $141,750 |
| 2018 | $10,128 | $218,330 | $76,580 | $141,750 |
| 2017 | $9,855 | $218,330 | $76,580 | $141,750 |
| 2016 | $9,746 | $218,330 | $76,580 | $141,750 |
| 2015 | $9,542 | $239,260 | $85,400 | $153,860 |
| 2014 | $9,542 | $239,260 | $85,400 | $153,860 |
Source: Public Records
Map
Nearby Homes
- 14 Annawon Ave
- 24 Anderson Ave
- 80 Holcomb St
- 43 Contact Dr
- 83 Pauline Ave
- 29 Anderson Ave
- 6 Howe St
- 11 Woodruff St
- 23 Warner Ave
- 46 Central Ave
- 216 Anderson Ave
- 18 Riverdale Rd
- 46 Salem Walk
- 19 Kaye Rd
- 22 Lynmoor St
- 461R Ocean Ave
- 330 Merwin Ave Unit 1D
- 106 Hawley Ave
- 36 Kenwood Rd
- 32 1/2 Village Rd
- 96 Ocean Ave
- 96 Ocean Ave Unit 2nd Floor
- 96 Ocean Ave Unit 1st Floor
- 17 Nashawena Ave
- 92 Ocean Ave
- 108 Ocean Ave
- 14 Nashawena Ave
- 90 Ocean Ave
- 101 Ocean Ave
- 19 Nashawena Ave
- 16 Nashawena Ave
- 93 Ocean Ave
- 88 Ocean Ave
- 91 Ocean Ave
- 21 Nashawena Ave
- 107 Ocean Ave
- 86 Ocean Ave
- 20 Nashawena Ave
- 112 Ocean Ave
- 89 Ocean Ave
Your Personal Tour Guide
Ask me questions while you tour the home.