
Seller's Agent in 2020
Hejoma Garcia
RE/MAX
(774) 242-8832
1 in this area
125 Total Sales
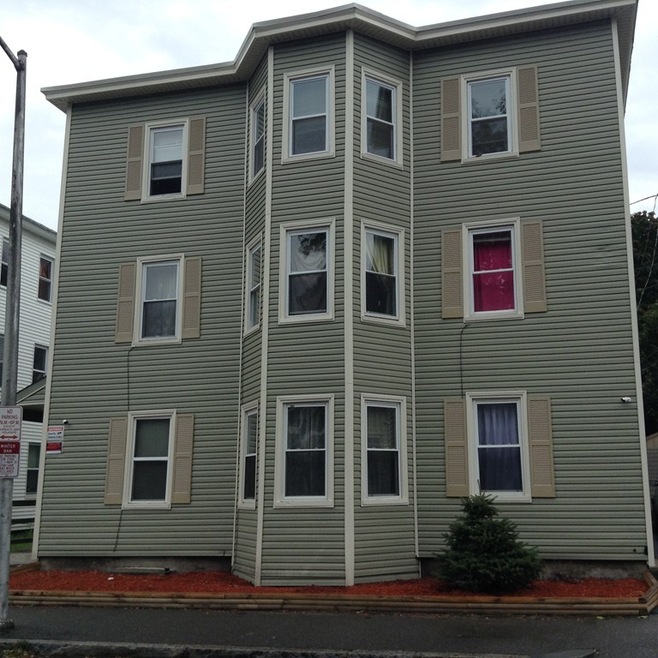


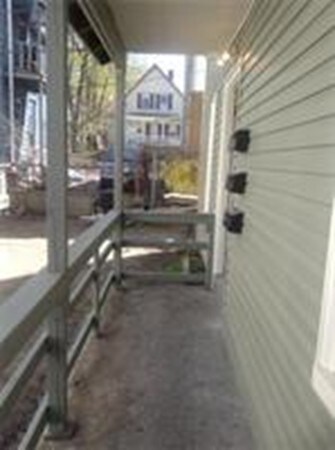
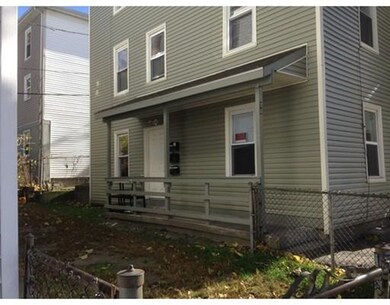
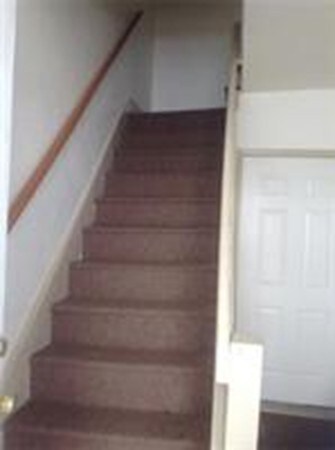
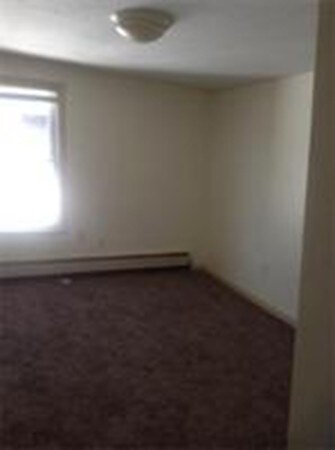
Great opportunity to own rental property. Recently renovated three family residence. Updated electrical, plumbing and landscaping (tree removal). Lead paint certificates but may need updating. High-tech energy efficient boiler supplies heat and hot water to entire house. New circulators and condensate pump in basement. Excellent commuter location. Close to Routes 3, 9, 290, 122A and the Mass Pike. New driveway, shutters, security camera, and gutters. New rugs on 3rd floor, new bathroom vents and vents over stoves.Vinyl sided and replacement windows great cash flow for investors or owner occupier. Leases expire as follows, First Sept. 15,2018 Second Oct. 26,2018 and third Dec. 1,2018
Last Agent to Sell the Property
ERA Key Realty Services - Worcester Listed on: 09/11/2018
| Date | Type | Sale Price | Title Company |
|---|---|---|---|
| Not Resolvable | $350,000 | Misc Company | |
| Not Resolvable | $280,650 | -- | |
| Not Resolvable | $191,000 | -- | |
| Not Resolvable | $179,225 | -- | |
| Foreclosure Deed | $84,000 | -- | |
| Deed | $85,000 | -- | |
| Deed | $25,000 | -- | |
| Deed | $138,900 | -- |
| Date | Status | Loan Amount | Loan Type |
|---|---|---|---|
| Open | $320,595 | FHA | |
| Closed | $320,512 | FHA | |
| Previous Owner | $209,650 | Adjustable Rate Mortgage/ARM | |
| Previous Owner | $181,450 | New Conventional | |
| Previous Owner | $20,000,000 | Stand Alone Refi Refinance Of Original Loan | |
| Previous Owner | $68,000 | Purchase Money Mortgage | |
| Previous Owner | $23,750 | Purchase Money Mortgage | |
| Previous Owner | $28,000 | No Value Available |
| Date | Event | Price | Change | Sq Ft Price |
|---|---|---|---|---|
| 06/23/2020 06/23/20 | Sold | $350,000 | 0.0% | $99 / Sq Ft |
| 05/11/2020 05/11/20 | Pending | -- | -- | -- |
| 05/03/2020 05/03/20 | For Sale | $349,900 | 0.0% | $99 / Sq Ft |
| 03/23/2020 03/23/20 | Pending | -- | -- | -- |
| 02/24/2020 02/24/20 | For Sale | $349,900 | +24.7% | $99 / Sq Ft |
| 11/19/2018 11/19/18 | Sold | $280,650 | -3.2% | $80 / Sq Ft |
| 10/10/2018 10/10/18 | Pending | -- | -- | -- |
| 10/05/2018 10/05/18 | Price Changed | $290,000 | -1.7% | $82 / Sq Ft |
| 10/01/2018 10/01/18 | Price Changed | $295,000 | -1.6% | $84 / Sq Ft |
| 09/11/2018 09/11/18 | For Sale | $299,900 | +57.0% | $85 / Sq Ft |
| 08/17/2017 08/17/17 | Sold | $191,000 | +0.5% | $54 / Sq Ft |
| 06/21/2017 06/21/17 | Pending | -- | -- | -- |
| 06/17/2017 06/17/17 | For Sale | $190,000 | +6.0% | $54 / Sq Ft |
| 10/14/2014 10/14/14 | Sold | $179,250 | -23.7% | $51 / Sq Ft |
| 09/14/2014 09/14/14 | Pending | -- | -- | -- |
| 05/09/2014 05/09/14 | For Sale | $235,000 | -- | $67 / Sq Ft |
| Year | Tax Paid | Tax Assessment Tax Assessment Total Assessment is a certain percentage of the fair market value that is determined by local assessors to be the total taxable value of land and additions on the property. | Land | Improvement |
|---|---|---|---|---|
| 2025 | $7,516 | $569,800 | $40,100 | $529,700 |
| 2024 | $6,849 | $498,100 | $40,100 | $458,000 |
| 2023 | $6,559 | $457,400 | $32,200 | $425,200 |
| 2022 | $5,725 | $376,400 | $25,800 | $350,600 |
| 2021 | $5,252 | $322,600 | $20,600 | $302,000 |
| 2020 | $4,803 | $282,500 | $20,700 | $261,800 |
| 2019 | $3,496 | $194,200 | $20,400 | $173,800 |
| 2018 | $3,398 | $179,700 | $20,400 | $159,300 |
| 2017 | $3,167 | $164,800 | $20,400 | $144,400 |
| 2016 | $3,120 | $151,400 | $17,300 | $134,100 |
| 2015 | $2,394 | $119,300 | $17,300 | $102,000 |
| 2014 | $2,331 | $119,300 | $17,300 | $102,000 |
Seller's Agent in 2020
Hejoma Garcia
RE/MAX
(774) 242-8832
1 in this area
125 Total Sales
Buyer's Agent in 2020
Jasmine Ortiz
HestiaLiving Corporation
(774) 437-2503
24 Total Sales
Seller's Agent in 2018
Jesse Ritz
ERA Key Realty Services - Worcester
(508) 450-5011
6 Total Sales
Seller's Agent in 2017
Jay Falone
RE/MAX
(508) 561-0742
43 Total Sales
Buyer's Agent in 2014
Ann Marie Belair
Sterling Realty Belair, INC
(508) 523-2676
12 Total Sales
Source: MLS Property Information Network (MLS PIN)
MLS Number: 72393000
APN: WORC-000006-000006-000041
Disclaimer: Certain information contained herein is derived from information provided by parties other than Homes.com. All information provided is deemed reliable, but is not guaranteed to be accurate and should be independently verified.
![]() The property listing data and information, or the Images, set forth herein were provided to MLS Property Information Network, Inc. from third party sources, including sellers, lessors and public records, and were compiled by MLS Property Information Network, Inc. The property listing data and information, and the Images, are for the personal, non-commercial use of consumers having a good faith interest in purchasing or leasing listed properties of the type displayed to them and may not be used for any purpose other than to identify prospective properties which such consumers may have a good faith interest in purchasing or leasing. MLS Property Information Network, Inc. and its subscribers disclaim any and all representations and warranties as to the accuracy of the property listing data and information, or as to the accuracy of any of the Images, set forth herein.
The property listing data and information, or the Images, set forth herein were provided to MLS Property Information Network, Inc. from third party sources, including sellers, lessors and public records, and were compiled by MLS Property Information Network, Inc. The property listing data and information, and the Images, are for the personal, non-commercial use of consumers having a good faith interest in purchasing or leasing listed properties of the type displayed to them and may not be used for any purpose other than to identify prospective properties which such consumers may have a good faith interest in purchasing or leasing. MLS Property Information Network, Inc. and its subscribers disclaim any and all representations and warranties as to the accuracy of the property listing data and information, or as to the accuracy of any of the Images, set forth herein.