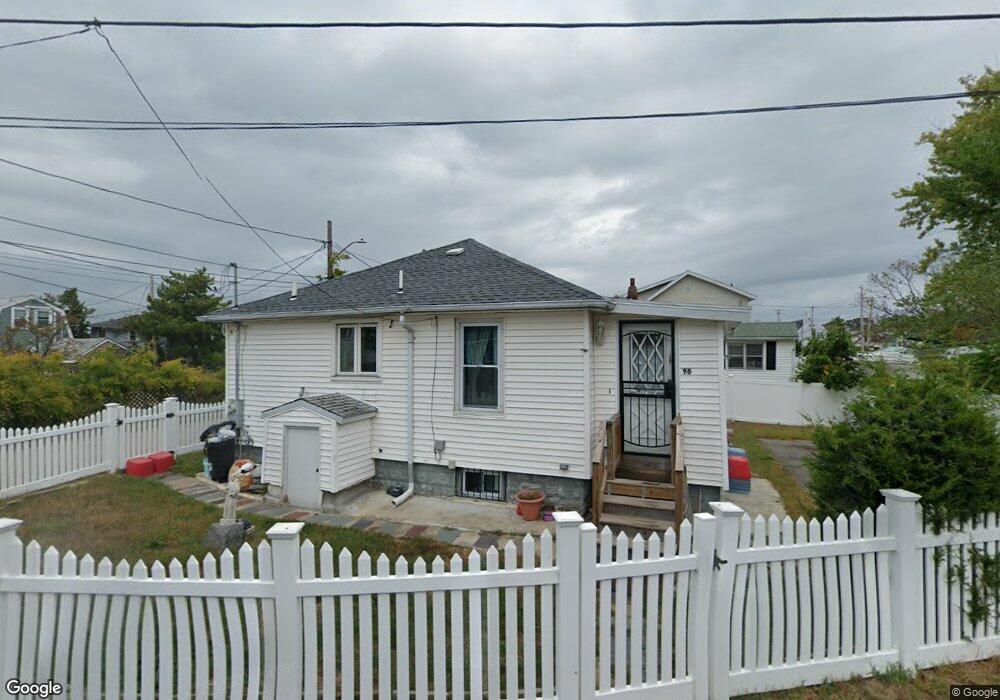
96 Post Island Rd Quincy, MA 02169
Adams Shore NeighborhoodEstimated Value: $408,000 - $547,000
2
Beds
1
Bath
960
Sq Ft
$526/Sq Ft
Est. Value
About This Home
This home is located at 96 Post Island Rd, Quincy, MA 02169 and is currently estimated at $504,488, approximately $525 per square foot. 96 Post Island Rd is a home located in Norfolk County with nearby schools including Merrymount Elementary School, Broad Meadows Middle School, and Quincy High School.
Ownership History
Date
Name
Owned For
Owner Type
Purchase Details
Closed on
Dec 2, 2011
Sold by
Connell Blanche M Est
Bought by
Chacon Sandra M
Current Estimated Value
Home Financials for this Owner
Home Financials are based on the most recent Mortgage that was taken out on this home.
Original Mortgage
$146,172
Outstanding Balance
$103,145
Interest Rate
4.25%
Mortgage Type
FHA
Estimated Equity
$401,343
Create a Home Valuation Report for This Property
The Home Valuation Report is an in-depth analysis detailing your home's value as well as a comparison with similar homes in the area
Home Values in the Area
Average Home Value in this Area
Purchase History
| Date | Buyer | Sale Price | Title Company |
|---|---|---|---|
| Chacon Sandra M | $150,000 | -- |
Source: Public Records
Mortgage History
| Date | Status | Borrower | Loan Amount |
|---|---|---|---|
| Open | Chacon Sandra M | $146,172 |
Source: Public Records
Tax History Compared to Growth
Tax History
| Year | Tax Paid | Tax Assessment Tax Assessment Total Assessment is a certain percentage of the fair market value that is determined by local assessors to be the total taxable value of land and additions on the property. | Land | Improvement |
|---|---|---|---|---|
| 2025 | $5,079 | $440,500 | $248,100 | $192,400 |
| 2024 | $4,862 | $431,400 | $240,900 | $190,500 |
| 2023 | $4,409 | $396,100 | $209,400 | $186,700 |
| 2022 | $4,401 | $367,400 | $190,400 | $177,000 |
| 2021 | $4,211 | $346,900 | $190,400 | $156,500 |
| 2020 | $3,912 | $314,700 | $183,100 | $131,600 |
| 2019 | $3,710 | $295,600 | $171,100 | $124,500 |
| 2018 | $3,488 | $261,500 | $148,800 | $112,700 |
| 2017 | $3,496 | $246,700 | $148,800 | $97,900 |
| 2016 | $3,456 | $240,700 | $148,800 | $91,900 |
| 2015 | $3,270 | $224,000 | $140,400 | $83,600 |
| 2014 | $3,184 | $214,300 | $133,700 | $80,600 |
Source: Public Records
Map
Nearby Homes
- 3 Shoreside Rd
- 7 Shoreside Rd
- 11 Shoreside Rd
- 84 Post Island Rd
- 99 Post Island Rd Unit 2
- 99 Post Island Rd Unit 4
- 99 Post Island Rd Unit 2
- 99 Post Island Rd
- 99 Post Island Rd Unit 1
- 10 Shoreside Rd Unit 1
- 10 Shoreside Rd Unit A
- 10 Shoreside Rd
- 648 Sea St
- 86 Post Island Rd
- 89 Post Island Rd
- 8 Shoreside Rd
- 8 Shoreside Rd Unit 8
- 8 Shoreside Rd Unit 2
- 8 Shoreside Rd Unit 1
- 8 Shoreside Rd Unit A