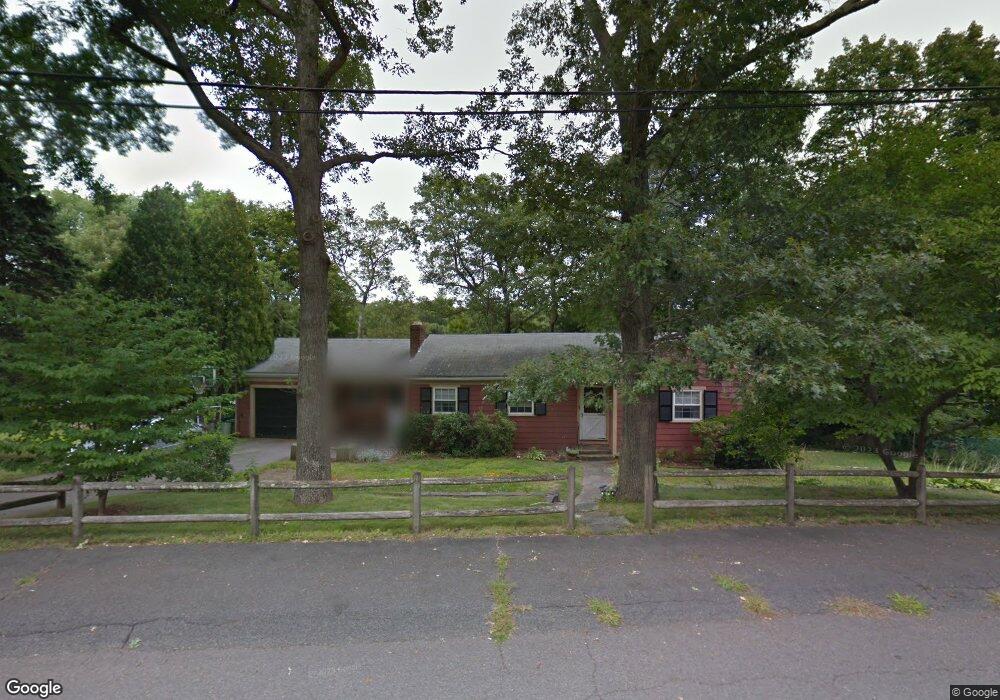
96 Progress St Weymouth, MA 02188
South Weymouth NeighborhoodEstimated Value: $604,000 - $630,000
3
Beds
2
Baths
1,346
Sq Ft
$456/Sq Ft
Est. Value
About This Home
This home is located at 96 Progress St, Weymouth, MA 02188 and is currently estimated at $613,255, approximately $455 per square foot. 96 Progress St is a home located in Norfolk County with nearby schools including Frederick C Murphy, Abigail Adams Middle School, and Weymouth Middle School Chapman.
Ownership History
Date
Name
Owned For
Owner Type
Purchase Details
Closed on
Oct 20, 1999
Sold by
Trott Tr David C
Bought by
Doogue Mark N and Doogue Sandra L
Current Estimated Value
Home Financials for this Owner
Home Financials are based on the most recent Mortgage that was taken out on this home.
Original Mortgage
$159,750
Interest Rate
7.83%
Mortgage Type
Purchase Money Mortgage
Create a Home Valuation Report for This Property
The Home Valuation Report is an in-depth analysis detailing your home's value as well as a comparison with similar homes in the area
Home Values in the Area
Average Home Value in this Area
Purchase History
| Date | Buyer | Sale Price | Title Company |
|---|---|---|---|
| Doogue Mark N | $177,500 | -- |
Source: Public Records
Mortgage History
| Date | Status | Borrower | Loan Amount |
|---|---|---|---|
| Open | Doogue Mark N | $83,000 | |
| Open | Doogue Mark N | $157,200 | |
| Closed | Doogue Mark N | $159,750 |
Source: Public Records
Tax History
| Year | Tax Paid | Tax Assessment Tax Assessment Total Assessment is a certain percentage of the fair market value that is determined by local assessors to be the total taxable value of land and additions on the property. | Land | Improvement |
|---|---|---|---|---|
| 2025 | $5,214 | $516,200 | $226,300 | $289,900 |
| 2024 | $5,159 | $502,300 | $215,600 | $286,700 |
| 2023 | $4,861 | $465,200 | $199,600 | $265,600 |
| 2022 | $4,618 | $403,000 | $169,400 | $233,600 |
| 2021 | $4,557 | $388,200 | $169,400 | $218,800 |
| 2020 | $4,524 | $379,500 | $169,400 | $210,100 |
| 2019 | $4,301 | $354,900 | $162,900 | $192,000 |
| 2018 | $4,165 | $333,200 | $155,200 | $178,000 |
| 2017 | $4,044 | $315,700 | $156,500 | $159,200 |
| 2016 | $4,023 | $314,300 | $158,800 | $155,500 |
| 2015 | $3,782 | $293,200 | $151,600 | $141,600 |
| 2014 | $3,716 | $279,400 | $141,100 | $138,300 |
Source: Public Records
Map
Nearby Homes
- 501 Commerce Dr Unit 2310
- 501 Commerce Dr Unit 4308
- 82 Lester Ln
- 73 Ryder Rd
- 17 Berean Way
- 300 West St
- 8 Tara Dr Unit 4
- 8 Tara Dr Unit 5
- 107 Summer St
- 33 Congress St
- 747 Middle St
- 432 Grove St
- 54 Old Quarry Dr
- 15 Summer St
- 2 Mitchell Ln Unit B
- 972 Liberty St
- 116 Greenvale Ave
- 31 Doris Rd
- 206 Tall Oaks Dr Unit D
- 19 Vine St Unit 3
- 88 Progress St
- 104 Progress St
- 210 Belmont St
- 107 Progress St
- 80 Progress St
- 85 Progress St
- 201 Belmont St
- 75 Progress St
- 193 Belmont St
- 188 Belmont St
- 72 Progress St
- 187 Belmont St
- 16 Jacquelyn Rd
- 215 Belmont St
- 185 Belmont St
- 67 Progress St
- 64 Progress St
- 24 Jacquelyn Rd
- 180 Belmont St
- 177 Belmont St
Your Personal Tour Guide
Ask me questions while you tour the home.