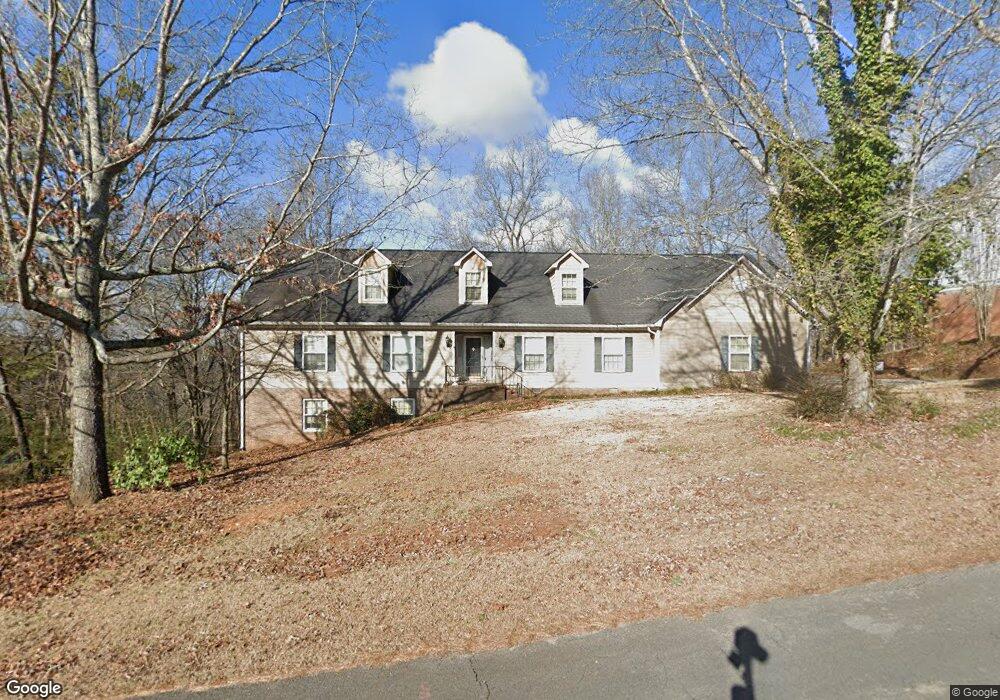
96 Ridgeview Dr SE Silver Creek, GA 30173
Estimated Value: $300,000 - $418,000
--
Bed
2
Baths
2,764
Sq Ft
$129/Sq Ft
Est. Value
About This Home
This home is located at 96 Ridgeview Dr SE, Silver Creek, GA 30173 and is currently estimated at $356,666, approximately $129 per square foot. 96 Ridgeview Dr SE is a home located in Floyd County with nearby schools including Pepperell Middle School and Pepperell High School.
Ownership History
Date
Name
Owned For
Owner Type
Purchase Details
Closed on
May 25, 2007
Sold by
Not Provided
Bought by
Brooks Julie A
Current Estimated Value
Home Financials for this Owner
Home Financials are based on the most recent Mortgage that was taken out on this home.
Original Mortgage
$216,000
Outstanding Balance
$131,314
Interest Rate
6.16%
Mortgage Type
New Conventional
Estimated Equity
$225,352
Purchase Details
Closed on
Jun 9, 2000
Sold by
Millican E Spencer Jr Family Limited Par
Bought by
Brooks Dana F and Brooks Julie A
Purchase Details
Closed on
Dec 29, 1997
Sold by
Millican Edward Spencer and Martha Swan
Bought by
Millican E Spencer Jr Family Limited Par
Purchase Details
Closed on
Jun 22, 1994
Sold by
Mcgraw Robert L and Mcgraw Jimmy C
Bought by
Millican Edward Spencer and Millican Martha
Purchase Details
Closed on
Jul 25, 1988
Sold by
Tanner David L and Tanner Brenda
Bought by
Mcgraw Robert L and Mcgraw Jimmy C
Purchase Details
Closed on
Oct 2, 1986
Bought by
Tanner David L and Tanner Brenda
Create a Home Valuation Report for This Property
The Home Valuation Report is an in-depth analysis detailing your home's value as well as a comparison with similar homes in the area
Home Values in the Area
Average Home Value in this Area
Purchase History
| Date | Buyer | Sale Price | Title Company |
|---|---|---|---|
| Brooks Julie A | $216,000 | -- | |
| Brooks Dana F | $178,000 | -- | |
| Millican E Spencer Jr Family Limited Par | -- | -- | |
| Millican Edward Spencer | $148,500 | -- | |
| Mcgraw Robert L | $131,800 | -- | |
| Tanner David L | -- | -- |
Source: Public Records
Mortgage History
| Date | Status | Borrower | Loan Amount |
|---|---|---|---|
| Open | Brooks Julie A | $216,000 |
Source: Public Records
Tax History Compared to Growth
Tax History
| Year | Tax Paid | Tax Assessment Tax Assessment Total Assessment is a certain percentage of the fair market value that is determined by local assessors to be the total taxable value of land and additions on the property. | Land | Improvement |
|---|---|---|---|---|
| 2024 | $3,290 | $145,542 | $5,152 | $140,390 |
| 2023 | $3,309 | $141,898 | $4,579 | $137,319 |
| 2022 | $2,948 | $117,949 | $3,721 | $114,228 |
| 2021 | $2,639 | $98,312 | $3,721 | $94,591 |
| 2020 | $2,582 | $94,091 | $2,862 | $91,229 |
| 2019 | $2,489 | $90,589 | $2,862 | $87,727 |
| 2018 | $2,171 | $75,335 | $2,862 | $72,473 |
| 2017 | $2,074 | $71,981 | $2,862 | $69,119 |
| 2016 | $2,077 | $71,240 | $2,840 | $68,400 |
| 2015 | $2,126 | $74,354 | $2,840 | $71,514 |
| 2014 | $2,126 | $74,354 | $2,840 | $71,514 |
Source: Public Records
Map
Nearby Homes
- 22 Timberwood Dr SE
- 0 Wedgewood Dr
- Lot 54 Ridgeview Dr SE
- 16 Timberwood Dr SE
- 62 Ramblewood Dr SE
- 37 Ramblewood Dr SE
- 12 Indian River Rd SE
- 7 Timberwood Dr SE
- 697A Donahoo Rd SE
- 550 Donahoo Rd SE
- 23 Rainwood Cir SE
- 11 Ridgeview Dr SE
- 13 Rainwood Dr SE
- 2 Silvermont Dr SE
- 965 Old Rockmart Rd SE
- 1531 Old Rockmart Rd SE
- 865 Old Rockmart Rd SE
- 135 Reeceburg Rd SE
- 4622 Rockmart Rd SE
- 96 Ridgeview Dr SE
- 94 Ridgeview Dr SE
- 94 Ridgeview Dr SE
- 98 Ridgeview Dr SE
- 97 Ridgeview Dr SE
- 91 Ridgeview Dr SE
- 92 Ridgeview Dr SE
- 100 Ridgeview Dr SE Unit 102&103
- 100 Ridgeview Dr SE
- 99 Ridgeview Dr SE
- 88 Ridgeview Dr SE
- 88 Ridgeview Dr SE Unit Section 6
- 39 Ridgefield Dr SE
- 4 Moreland Ct SE
- 52 Timberwood Dr SE
- 101 Ridgeview Dr SE
- 37 Ridgefield Dr SE
- 89 Ridgeview Dr SE
- 50 Timberwood Dr SE
- 57 Timberwood Dr SE