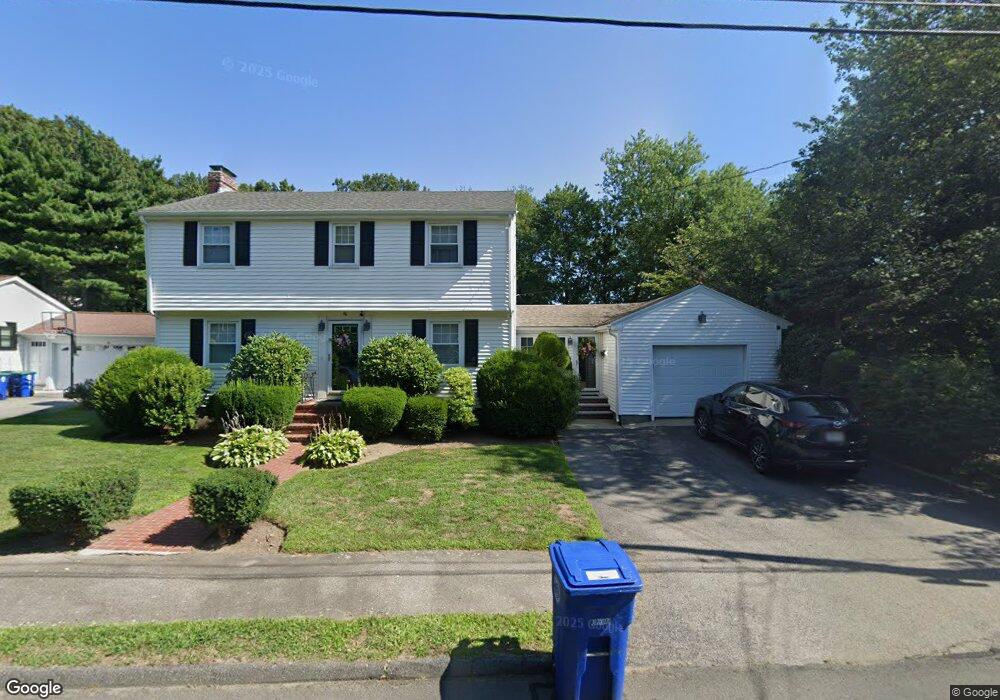
96 Robert St Braintree, MA 02184
East Braintree NeighborhoodEstimated Value: $770,911 - $969,000
4
Beds
2
Baths
2,052
Sq Ft
$434/Sq Ft
Est. Value
About This Home
This home is located at 96 Robert St, Braintree, MA 02184 and is currently estimated at $889,728, approximately $433 per square foot. 96 Robert St is a home located in Norfolk County with nearby schools including Braintree High School, Meeting House Montessori School, and Step Ahead Kindergarten.
Ownership History
Date
Name
Owned For
Owner Type
Purchase Details
Closed on
Oct 10, 2008
Sold by
Chin Henry and Chin Mary T
Bought by
Chin Henry and Chin Mary T
Current Estimated Value
Purchase Details
Closed on
Jun 24, 2005
Sold by
Dole Nominee Rt and Dole Kathleen
Bought by
Chin Henry and Chin Mary T
Home Financials for this Owner
Home Financials are based on the most recent Mortgage that was taken out on this home.
Original Mortgage
$428,000
Interest Rate
5.82%
Mortgage Type
Purchase Money Mortgage
Purchase Details
Closed on
Jun 7, 2004
Sold by
Dole Kathleen and Dole Robert J
Bought by
Dole Nt and Dole Kathleen
Purchase Details
Closed on
Jul 3, 1991
Sold by
Est Cenci Virgilio G
Bought by
Dole Robert J and Dole Kathleen F
Home Financials for this Owner
Home Financials are based on the most recent Mortgage that was taken out on this home.
Original Mortgage
$150,000
Interest Rate
9.37%
Mortgage Type
Purchase Money Mortgage
Create a Home Valuation Report for This Property
The Home Valuation Report is an in-depth analysis detailing your home's value as well as a comparison with similar homes in the area
Home Values in the Area
Average Home Value in this Area
Purchase History
| Date | Buyer | Sale Price | Title Company |
|---|---|---|---|
| Chin Henry | -- | -- | |
| Chin Henry | $535,000 | -- | |
| Dole Nt | -- | -- | |
| Dole Robert J | $210,000 | -- | |
| Dole Robert J | $210,000 | -- |
Source: Public Records
Mortgage History
| Date | Status | Borrower | Loan Amount |
|---|---|---|---|
| Open | Dole Robert J | $332,000 | |
| Previous Owner | Chin Henry | $428,000 | |
| Previous Owner | Dole Robert J | $150,000 |
Source: Public Records
Tax History
| Year | Tax Paid | Tax Assessment Tax Assessment Total Assessment is a certain percentage of the fair market value that is determined by local assessors to be the total taxable value of land and additions on the property. | Land | Improvement |
|---|---|---|---|---|
| 2025 | $7,262 | $727,700 | $402,800 | $324,900 |
| 2024 | $6,524 | $688,200 | $377,600 | $310,600 |
| 2023 | $6,113 | $626,300 | $332,300 | $294,000 |
| 2022 | $5,931 | $596,100 | $302,100 | $294,000 |
| 2021 | $5,294 | $532,100 | $254,800 | $277,300 |
| 2020 | $5,247 | $532,100 | $254,800 | $277,300 |
| 2019 | $5,062 | $501,700 | $254,800 | $246,900 |
| 2018 | $4,832 | $458,400 | $221,500 | $236,900 |
| 2017 | $4,600 | $428,300 | $201,400 | $226,900 |
| 2016 | $4,336 | $394,900 | $181,300 | $213,600 |
| 2015 | $4,233 | $382,400 | $177,200 | $205,200 |
| 2014 | $4,036 | $353,400 | $163,100 | $190,300 |
Source: Public Records
Map
Nearby Homes
- 17 White Rd
- 9 Independence Ave Unit 307
- 192 Federal Ave Unit B
- 342 Elm St
- 99 Verchild St
- 177 Franklin St
- 155 Kendrick Ave Unit 502
- 56 Penn St Unit 4
- 20 Vine St
- 166 Phipps St
- 63 Dickerman Ln
- 50 N Payne St Unit 6
- 29 Joseph Rd
- 87 Franklin St Unit 105
- 21 Totman St Unit 205
- 21 Totman St Unit 404
- 21 Totman St Unit 309
- 21 Totman St Unit 409
- 21 Totman St Unit 203
- 21 Totman St Unit 301
Your Personal Tour Guide
Ask me questions while you tour the home.