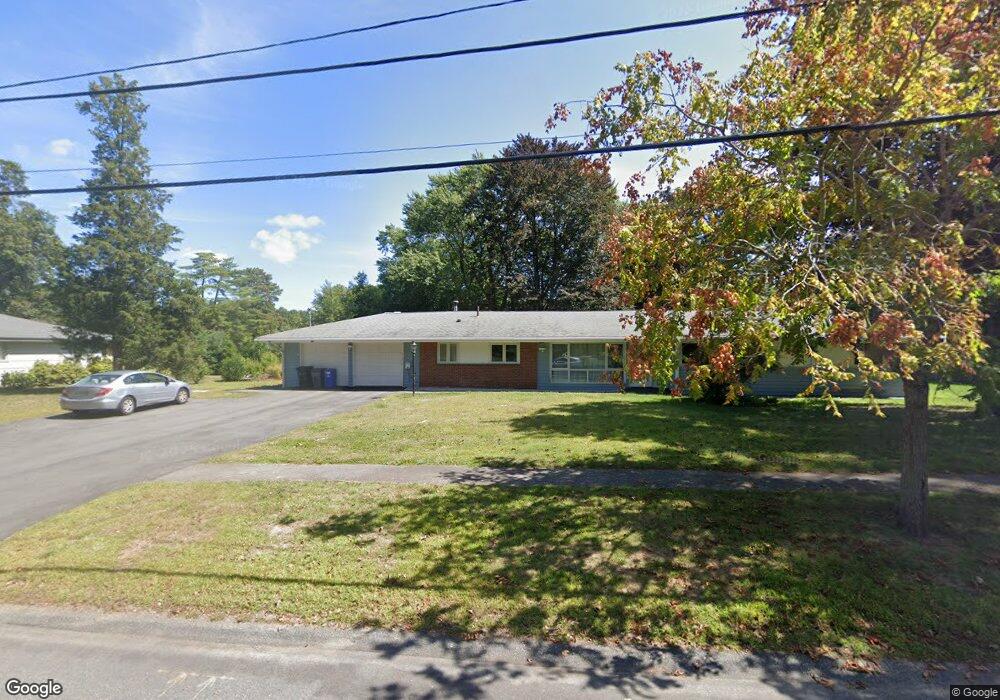
96 Scotland St Hingham, MA 02043
South Hingham NeighborhoodEstimated Value: $914,000 - $1,154,974
4
Beds
3
Baths
2,316
Sq Ft
$445/Sq Ft
Est. Value
About This Home
This home is located at 96 Scotland St, Hingham, MA 02043 and is currently estimated at $1,031,744, approximately $445 per square foot. 96 Scotland St is a home located in Plymouth County with nearby schools including South Elementary School, South Shore Charter Public School, and Norwell KinderCare.
Ownership History
Date
Name
Owned For
Owner Type
Purchase Details
Closed on
Jun 23, 2020
Sold by
Hingham T
Bought by
Williams Laura A and Wishner Sara M
Current Estimated Value
Home Financials for this Owner
Home Financials are based on the most recent Mortgage that was taken out on this home.
Original Mortgage
$392,000
Outstanding Balance
$346,824
Interest Rate
3.1%
Mortgage Type
New Conventional
Estimated Equity
$684,920
Purchase Details
Closed on
Jan 27, 2010
Sold by
Ritchie S Lois
Bought by
Hingham T and Ritchie S Lois
Purchase Details
Closed on
Nov 11, 1966
Bought by
Lois Ritchie S
Create a Home Valuation Report for This Property
The Home Valuation Report is an in-depth analysis detailing your home's value as well as a comparison with similar homes in the area
Home Values in the Area
Average Home Value in this Area
Purchase History
| Date | Buyer | Sale Price | Title Company |
|---|---|---|---|
| Williams Laura A | $560,000 | None Available | |
| Hingham T | -- | -- | |
| Lois Ritchie S | -- | -- |
Source: Public Records
Mortgage History
| Date | Status | Borrower | Loan Amount |
|---|---|---|---|
| Open | Williams Laura A | $392,000 | |
| Previous Owner | Lois Ritchie S | $140,000 | |
| Previous Owner | Lois Ritchie S | $140,000 |
Source: Public Records
Tax History Compared to Growth
Tax History
| Year | Tax Paid | Tax Assessment Tax Assessment Total Assessment is a certain percentage of the fair market value that is determined by local assessors to be the total taxable value of land and additions on the property. | Land | Improvement |
|---|---|---|---|---|
| 2025 | $9,045 | $846,100 | $463,900 | $382,200 |
| 2024 | $8,512 | $784,500 | $463,900 | $320,600 |
| 2023 | $7,763 | $776,300 | $463,900 | $312,400 |
| 2022 | $6,708 | $580,300 | $358,100 | $222,200 |
| 2021 | $6,599 | $559,200 | $358,100 | $201,100 |
| 2020 | $6,448 | $559,200 | $358,100 | $201,100 |
| 2019 | $6,465 | $547,400 | $358,100 | $189,300 |
| 2018 | $6,165 | $523,800 | $358,100 | $165,700 |
| 2017 | $6,410 | $523,300 | $366,200 | $157,100 |
| 2016 | $6,319 | $505,900 | $348,800 | $157,100 |
| 2015 | $6,130 | $489,200 | $332,100 | $157,100 |
Source: Public Records
Map
Nearby Homes
- 4 Richard Rd
- 1088 Main St
- 12 Hoover Rd
- 1 Kerri Ln
- 23 Mast Hill Rd
- 3 Patriots Way
- 100 Whiting St
- 15 Pioneer Rd
- 214 Washington St Unit 24
- 214 Washington St Unit 28
- 251 Prospect St
- 212 Cushing St
- 18 Whiting Ln
- 433 Grove St
- 32-70 Lazell St
- 3 Howland Ln
- 80 Coolidge Rd
- 225 Prospect St
- 18 Colby St
- 639 Main St